| 1. | ||
| 2. | ||
| 3. | ||
| 3.1. | ||
| 3.2. | ||
| 3.3. | ||
| 4. | ||
Modification and Characterization of Single-Wall Carbon Nanotubes Treated by Nitric Acid
A. Diama1, *, V. Manu2, M. Grafoute1, H. C. Bajaj2
1Department of Condensed Matter and Technology, University of Felix Houphouet Boigny, Abidjan, Côte d’Ivoire
2Department of Discipline of Inorganic Materials and Catalysis (DIMC), Central Salt and Marine Chemicals Research Institute (CSMCRI), Bhavnagar, India
Email address
 (A. Diama)
 Citation
A. Diama, V. Manu, M. Grafoute, H. C. Bajaj. Modification and Characterization of Single-Wall Carbon Nanotubes Treated by Nitric Acid. Journal of Materials Sciences and Applications. Vol. 2, No. 3, 2016, pp. 25-29.
Abstract
As prepared single-wall carbon nanotube (AP-SWCNT) was purified with nitric acid (SWCNT-HNO3) treatment process. The N2 (adsorption/desorption) measurement showed an increased of the surface area for the raw material to the SWCNT 4 normal (4N) acid (HNO3) treatment material, and a decrease surface area for the SWCNT-4N acid treatment material to the SWCNT-8N acid treatment material. The transmission electron microscopy (TEM) analysis implied that some amorphous carbons have been removed from the treated samples and defects on the sidewalls have been observed. The X-ray powder diffraction (XRPD) results indicated an increased of the diffraction peak for the treated samples around 1.826 Q and 3.083 Q. The increased of the peak for the treated sample at 1.826 Q suggested that the amorphous carbon covering on the SWCNTs has been removed from the treated samples. However the increased of the peak intensity at 3.083 Q indicated the formation of functional groups on the SWCNT after acid treatment.
Keywords
Carbon Nanotubes, Acid Nitric, BET Surface Area, Adsorption Properties, Transmission Electron Microscopy, X Ray Powder Diffraction
1. Introduction
Since the discovery of carbon nanotubes (CNTs) [1], these nanoscale materials have attracted enormous interest because of their unique mechanical, thermal, optical, chemical, and electronic properties [2-6]. The CNTs composed of one graphite sheet are called single-walled carbon nanotubes (SWCNs), and those which are composed of more than one graphite sheet are called multiwalled carbon nanotubes (MWNTs) [7]. One mutual purpose in CNTs research is to obtain pure samples. Therefore, methods of their purification have been grown from the arc discharge to acid treatments [2-7]. The changes in morphology and surface area of the CNTs have been observed [6,8] both before and after purification. Among these various CNTs purification method, the acid treatment was widely used [9]. It has also been observed that such acid treatment changes the surface chemistry and oxygen containing functional groups [6] in the CNTs. Acid-treated CNTs generally contain carboxylic acid and hydroxyl groups, which are the most common functional groups on CNTs. Although this process can increase the dispersion property, it can also have a detrimental effect on the conductivity of the composites because of the morphological damage.
In order to understand an efficient purification protocol, a systematic study on the effect of acid treatment on as-prepared SWCNT (AP-SWCNT) has been carried out.
In this work, we present the results of the effect of concentration of nitric acid used for the purification on the textural, the structural and the morphology of SWCNTs. AP-SWCNT and purified materials were characterized by N2 adsorption/desorption isotherms at 77 K, the X ray powder diffraction (XRPD) and transmission electron microscopy (TEM).
2. Experimental Section
The single-walled carbon nanotube was from Carbon Solution Inc. with the purity between 40-60% and metal content Wt. 30%, designated as AP-SWCNT. AP-SWCNT was treated with 4 and 8 N nitric acid and was designated as SWCNT-4N and SWCNT-8N respectively. Known weight of the sample was suspended in nitric acid solution and refluxed at 70°C ± 2°C for 4 h in the case of 4N acid and 24 h in the case of 8N acid. After acid treatment, the samples were separated by filtration and washed thoroughly with deionized water until pH of the filtrate was neutral and dried in air at room temperature followed by drying at 90oC in hot air oven overnight. N2 adsorption study was carried out at liquid N2 temperature (~77K) using surface area analyzer ASAP 2010C (Micromeritics USA). Surface area was calculated by Brunauer–Emmett–Teller (BET) model, total pore volume and average pore diameter were calculated by Gurvitch method, pore size distribution analysis was done by BJH method using desorption branch of N2 isotherm. Micropore area and micropore volume were calculated using t-plot method [10].
A multitude of non-destructive techniques have been employed in order to characterize the samples. Detailed microstructural analysis has been carried out by transmission electron microscopy (TEM). Moreover, the crystallographic structure was investigated by X-ray diffraction via X’pert MPD diffractometer (Pan Analytical Holand) at 40 kV and 30 mA using monochromatized Cu Kα radiation (l = 1.5405 Å) in the 2q range from 5° to 90.0°.
3. Results and Discussion
3.1. Textural Properties
Results of textural properties of the AP-SWCNT, SWCNT-4N and SWCNT-8N analyzed by N2 (adsorption/desorption) studies at liquid N2 temperature (~77K) are shown in Figure 1 and 2. Textural parameters of the samples are summarized in Table 1. Adsorption isotherms of AP-SWCNT is of type i and iv with a hysteresis at p/p0 > 0.9 indicating the presence of framework micropores of the tubes and very large mesopores and macropores created due to aggregation of the particles or tubes respectively. After 4N acid treatment significant increase in adsorption of N2 at lower p/p0, corresponding to micropore (< 0.2) was observed, indicating the de-blocking of framework micropores of the SWCNT due to reaction of acid with metal particles. BJH pore size distribution profile of AP-SWCNT showed two shoulders at 21.7 Å and 32.4 Å. When sample was treated with 4 N acid, N2 adsorption capacity at lower p/p0 significantly increased indicating unblocking of micro pores by removal of the metal. BJH pore size distribution showed the formation of mesopores of about 40 Å size after acid treatment in both the cases. Results of table I indicated that when sample was treated with 4N HNO3, there was 14 times increase in micropore volume and 9 times increase in micropore area. Whereas increase in total pore volume BET surface area and external surface area was 1.3, 3.6 and 1.8 times respectively. These results also indicate the unblocking of micropore by dissolution of metal particles. Presence of narrow pore size in mesopore region at about 40 Åin acid treated samples indicates formation of a new phase. Generation of mesoporosity in SWCNT was reported by Y. H. Hu and E. Ruckenstein [11].
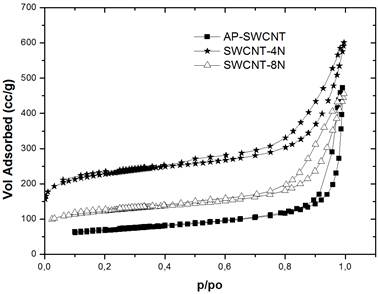
Figure 1. Isotherm linear plot of the SWCNT sample before (a) and after 4N (b) and 8N (c) nitric acid treatment.
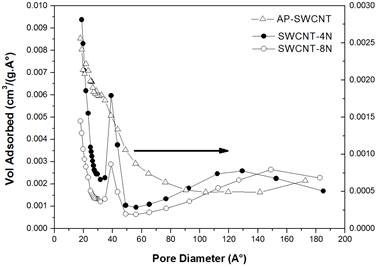
Figure 2. The BJH desorption dV/dD pore volume of the SWCNT sample before (a) and after 4N (b) and 8N (c) nitric acid treatment.
Table 1. Textural properties of the SWCNT sample before and after 4N and 8N nitric acid treatment by adsorption of N2 at liquid N2 temperature.
| AP-SWCNT | SWCNT-4N | SWCNT-8N | Ratio (SWCNT-4N / AP-SWCNT) | Ratio (SWCNT-8N / AP-SWCNT | |
| BET Surface area (m2.g-1) | 231 | 841 | 452 | 3.640693 | 1.95671 |
| Total Pore Volume (cm3.g-1) | 0.73 | 0.93 | 0.70 | 1.273973 | 0.958904 |
| Average Pore size (Å) | 126.3 | 44.23 | 62.41 | 0.350198 | 0.494141 |
| BJH Pore size (Å) | 21.7 | 39.0 | 38.8 | ||
| t-plot Micropore volume (cm3.g-1) | 0.015 | 0.21 | 0.042 | 14 | 2.8 |
| t-plot Micropore area (m2.g-1) | 58 | 525 | 161 | 9.051724 | 2.775862 |
| External Area (BET Area – Micropore Area) (m2.g-1) | 173 | 315 | 291 | 1.820809 | 1.682081 |
| % increase in Total surface area after acid treatment | 264 | 94.4 | |||
| % increase in Total pore volume | 27.4 | 4.1 | |||
| % increase in micropore area | 805 | 177 | |||
| % increase in micropore volume | 1300 | 180 |
The increase in the surface area of the treated sample at 4N indicates that refluxing in nitric acid had opened the ends of the SWCNT [1], and both defects and amorphous carbon could be partially removed and the wall structure integrity was improved.
When using a treatment in HNO3, amorphous carbons as well as metal particles are removed by oxidation reaction and dissolution respectively resulting in increase in surface area and pore. Similar effects have been reported in the literature [12-17]. The authors state that, the oxidative treatment of the SWCNTs is a good way to remove carbonaceous impurities or to clear the metal surface [13].
When the AP-SWCNT was treated under harsher condition with 8N HNO3 for 24 h, values of surface area and pore volume are less than those of (Table 1) SWCNT-4N. These differences in the effect of acid concentration and time of treatment on textural properties can be attributed to the partial degradation of the SWCNT under harsher condition. This can be further supported by the values of micropore area and micropore volume of the sample SWCNT-8N, which are significantly less than those of SWCNT-4N. It’s well known that nitric acid treatment introduce functional groups such as carbonyl, carboxyl and hydroxyl. Thus, the dramatic decrease of the surface area and the pore volume occur during the treatment at 8N could be related to the introduction of the functional groups which can introduce defects on the material. These results are in agreement with M. T. Martinez et al studies [18]. The authors show that the introduction of these functional groups as well as the intercalated HNO3 molecules blocking both the efficient entry of gases.
3.2. Structural Properties
Powder X ray diffraction patterns of the samples before and after acid treatment are shown in figure III. PXRD patterns indicated the presence of characteristic graphitic peak of (002) reflection at around 1.8 Q, in all the three samples [19-22]. The intensity of this peak increased by 1.7 and 2.5 times respectively for the 4N and 8N samples after acid treatment indicating improvement in the purity of SWCNT (Table 2). This peak at around 1.8 Q (d002 ~ 3.40 Å), exhibits an increase in intensity with increasing the concentration of the acid nitride as seen in Figure 3 b and 3 c. This result indicates that a large number of amorphous carbons have been removed. From curve b and c in Figure 3, we can observe that the FWHM of G (002) peak (~0.176) of the 4N and 8N SWCNT are ~0.0044 much smaller than that of the raw data (~0, 220) in Figure 3 a. It is known that narrower FWHM and higher intensities of G (002) peaks are indicative of a more developed graphitic structure [22].
Table 2. Powder XRD and surface area analysis of the modified SWCNT at 4N and 8N HNO3 treatment.
| Sample | AP-SWCNT | SWCNT-4N | SWCNT-8N |
| Intensity of d002 peak (cps) | 35 | 58 | 86 |
| Peak Intensity Ratio of d002 of samples before and after acid treatment | 1.68 | 2.5 | |
| Intensity of d111 peak (cps) | 200 | 301 | 428 |
| Peak Intensity Ratio of d111 of samples before and after acid treatment | 1.5 | 2.14 |
The other peaks, (111) and (200) corresponding to Q = 3.08 Å-1 and 3.55 Å-1, respectively indicate the presence of Ni-SWCNTs composites in the raw material. However, acid treatment also resulted in increase in intensity of 111 peak of Ni, which should decrease with an increase in acid concentration as reported by H. Hu et al [19]. These authors also reported the formation of amorphous carbon during the acid treatment. Ni particles were removed due to acid treatment as it could be clearly revealed from the results of textural properties and TEM (vide supra). However intensities of peak corresponding to Ni metal increased after acid treatment as can be seen from Figure 3. This could be attributed to the relative concentration Ni increased due to more removal of amorphous carbon compared to removal of Ni.
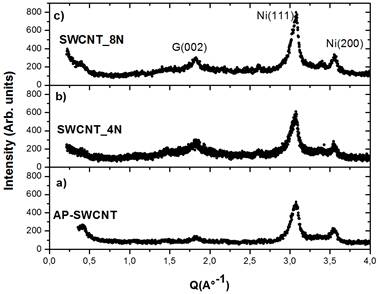
Figure 3. The X-ray powder diffraction (XRPD) patterns of the SWCNT sample before (a) and after 4N (b) and 8N (c) nitric acid treatment.
3.3. Morphology of the Samples Before and After HNO3 Treatment
A representative TEM images of the raw material used in this study is shown in Figure 4 a. To our best estimate, the material contained impurities like amorphous carbon, carbon nanoparticles, and metallic catalyst as indicated with the arrows in Figure 4 a. TEM images of the samples after 4N HNO3 treatment are shown in Figure 4 b. Comparing to the raw image, TEM material at 4N (Figure 4 b) examination confirms low purity of sample, it also clearly presents the influence of the HNO3 on the SWCNT material. The SWCNT on composite surface (Figure 4 b) with acid treatment is much better in quality than the raw sample (Figure 4 a). Figure 4 c shows TEM of sample treated with 8N HNO3 (SWCNT-8N). It is clear that impurities are removed from SWCNT as a result of purification at 8N. This result confirms above description (N2 (adsorption/desorption) and XRPD) that a large population of large nanoparticles, and amorphous carbon that were present before the HNO3 reaction have been removed from SWCNT as a result of purification. Additionally, the HNO3 treatment is also expected that the attachment of functional groups occurs at the cap of CNTs. This attachment might bring the change of morphology of the CNT by introducing some defects as observed in Figure 4 c. In addition, the decrease of the parameters (Surface area and pore volume at 8N) due to the partial degradation of the SWCNT can be observed in Figure 5 (see the arrow in insert).
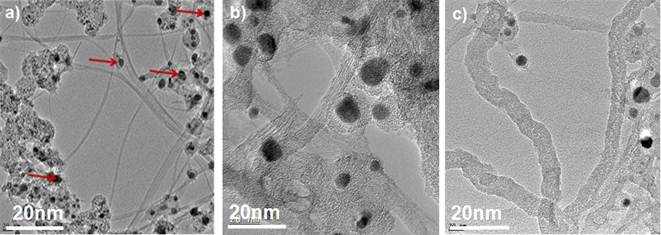
Figure 4. The TEM micrographs of the SWCNT sample before (a) and after 4N (b) and 8N (c) nitric acid (HNO3) treatment.
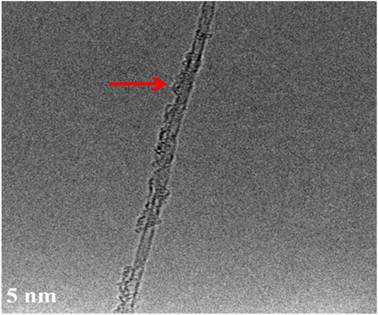
Figure 5. The TEM micrograph of SWCNT at 8N HNO3 treatment showing a partial degradation of the sidewall.
4. Conclusion
In summary, we have shown that the appropriate HNO3 treatment leads to a nondestructive purified SWCNT. Results of N2 absorption/desorption analysis indicated that 4N acid treatment was optimum concentration for the purification of SWCNT. Further increase in concentration and treatment time resulted in the decomposition of the sample. Finally we found that our TEM results of SWCNTs after acid treatment present better images with those from the raw material. All these results indicate that some of the amorphous carbons, carbon nanoparticles, are partially removed from the material. However, the increased of the XRD peaks at (111) and (200) showed that this method did not remove all the metal catalysts.
Acknowledgments
The authors are grateful for financial support from INSA-JRD TATA Fellowship D.O. /CCSTDS/1293/2008 and twas Research Grants 08-115/PHYS/AF/AC. We thank professor Aldo. D. Migone for proving the SWCNT.
References


