| 1. | ||
| 2. | ||
| 3. | ||
| 4. | ||
About Energy Consumption in Pneumatic Conveying of Raw Cotton
Sarimsakov Olimjon, Gayibnazarov Egamnazar
Namangan Institute Engineering and Technology, Namangan, Uzbekistan
Email address
 (S. Olimjon)
 Citation
Sarimsakov Olimjon, Gayibnazarov Egamnazar. About Energy Consumption in Pneumatic Conveying of Raw Cotton. American Journal of Energy and Power Engineering. Vol. 3, No. 4, 2016, pp. 26-29.
Abstract
The article presents the results of energy consumption investigations during pneumatic transport of raw cotton to ginneries. It gives opinions and proposals for reducing energy costs effective management of cotton pneumatic transport process based on the results of theoretical and applied research. Derived from the dependence of power consumption of the flow parameters, in particular of the average speed, the line pressure, and the length and diameter of the pipe. It recommended the use of 355 mm diameter pipe and 315 mm instead of 400 mm diameter pipe at a moderate rate of flow, which reduces the power consumption of the pneumatic installation.
Keywords
Raw Cotton, Pneumatic Installation, Aerodynamic Force, Static Pressure, Dynamic Pressure, Power Consumption
1. The Air Pressure in the Pneumatic Pipeline and Its Change
In the known theories on the pneumatic transport wind power is considered as a function of the square of the speed or airflow [1], [2], [3]. This means that it depends only on the dynamic pressure which, when a complete seal and the pipeline system element is constant, not varying along the length of the tube. However, experience shows that the magnitude of the aerodynamic force is not constant, but varies depending on the length of the tube - a maximum value of the fan and towards the beginning of the pipeline is gradually reduced, just as static pressure [4], [5], [6]. Based on these considerations, we have the task of establishing the influence of the static pressure on the value of wind power.
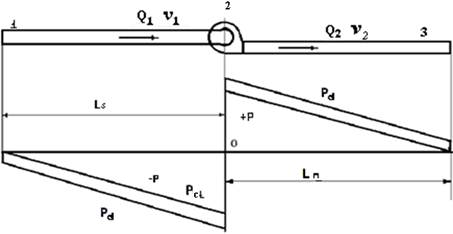
Fig. 1. Simplified diagram of the pneumatic installation.
To analyze the use Figure 1, where: 1 suction pipe, 2-fan (pump) 3 - forcing pipeline. In operation the fan 2 draws air from the conduit 1 and provides the pipe 2. Subsequently, the pipeline 1 is formed in the negative pressure (vacuum) - the vacuum, and in the 2nd positive (gauge) pressure. In this case, the fan creates a pressure value called nominal being passport fan pressure. Moreover, the total pressure consists of Pp 2 terms, Pd is the dynamic pressure and static Pct:
Рp = Pd + Pсt, (1)
Where Рp, Pd and Pсt is the pressure of the dimension of Pa.
The dynamic pressure Pd is, the kinematic energy of the flow, and depends only on its parameters - medium density ρ and speed ʋ:
Pd= 0,5 ρ ʋ2, (2)
Static pressure is the potential energy of the medium position. it is mathematically well described for a fixed environment, but for a moving medium is difficult to describe. Our studies show that we have proposed semi-empirical laws describing the change in the static pressure on the transportation lines are well supported with experimental data [7], [8]:
Pсt = Pн – Ри =Pн –0.5 ρυ2λ L/d, (3)
Here, Ри =0.5 ρυ2λ L/d - static pressure required to overcome the frictional force of the medium on the inner wall of the pipeline, Pa; PH -rated pressure developed by the fan during normal operation, Pa; ρ - density of the fluid kg / m3; υ - of the medium speed, m/s; λ- drag coefficient, L- length, d - diameter of the pipeline, m.
According to (1) the force applied to overcome the frictional force must be directed against it and the direction of motion of the medium. Based on this, change the sign between the terms in the (+) in the equation (3):
Pст = Pн +0.5 ρυ2λ L/d, (4)
The total pressure is defined as Pp = Pst + Pd. with this in mind (2) comes after some transformation to the form:
Pp= Pн+ 0.5 ρυ2(λ L/d +1), (5)
2. Formation of Wind Power and Power Consumption for Pneumatic Transport
Move medium in the pipeline produces aerodynamic force Ға(N), and the force of friction Ғи(N) seeks to stop the move [9,10]. A motion carried to as indicated above, should be accompanied by a force equal to Ғи but against its direction. Moreover, the aerodynamic force Ғa produce dynamic and static pressure and friction force Ғи - static. The resultant force Ғ contributing to the movement of the medium is equal to the multiplication of the total pressure on the cross-sectional area of the pipeline:
Ғa= Pp∙f= 0.25 πd2∙(Pcн+ 0.5 ρυ2(λ L/d +1)), (6)
Where f - the cross section of the tube, m2; Pcн–nominalstatic pressure generated by the fan; ρ- the density of the medium; L-length, d -diameter of the tube; λ-drag coefficient of 1 m pipe the movement of the flow.
If you pay attention to the last equation force Ғ increases with increasing length L and the drag coefficient decreases with increasing diameter of the pipeline and it is logical, because the greater the transport distance, the more energy it will take. If this power depended on the dynamic pressure, the tightness of the system at full strength would be constant over the entire length of the pipeline. However, according to (4) the value of the aerodynamic force is not constant. After simple transformations, we finally obtain:
Ғ=0.125 πd2∙(ru2(1+ λ L/d)+ 2Pсн), (7)
this force does the work of A (J- joul), equal When the system operation:
A = Fa∙L, (8)
Through the work done within the time device power consumption N (kWt) is as follows:
N = A / t = F L / t, (9)
The ratio of the distance on time is the average flow rate:
uр =L / t, (10)
Where uр-average speed, m/s; t - time of transport, s.
In view of the latter, we obtain the dependence of the power expended in moving the environment from the set parameters and flow:
N=0.125 πd2∙(ru2(1+ λ L/d)+ 2Pсн) uр, (11)
This formula shows that the power expended in transporting the medium depends largely on the average flow rate, then the parameters from the (inner surface resistance, length and diameter) of the pipeline.
3. Power Consumption in Pneumatic Conveying and Its Change
Let us analyze the dependence (11). Here, d indicator not only of the pipeline, and the index of the medium, too, because it determines the size of the cross-flow and is equal to the inner diameter of the pipe: d = 0.315; 0.355; 0.4 m. The air density ρ = 1,2 kg / m3, fuel mixture ρ = 1.65 kg / m3.
The length of the pipeline will take equal to L = 100 m.
λ - friction coefficient of the medium on the inner surface of the pipeline is:
- When air flows:
d = 0.315 м -λ=0. 068;
d = 0.355 м-λ=0.066;
d = 0.4 м-λ=0.064.
-With Movement aeromixture:
d = 0.315 м -λ=0. 134;
d = 0.355 м -λ=0.133;
d = 0.4 м-λ=0.132.
(Accepted as the average value of clean air friction coefficients (λ = 0.064-0. 068), and cotton (λ = 0.2) of the inner surface of the steel pipe).
The analysis is performed on a computer with standard programs, the results of which are presented in graph form in Figure 2, which show that they correctly describe the process: with increasing the flow rate of power consumption increases significantly.
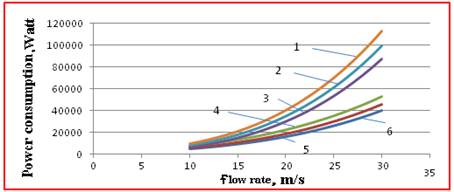
Fig. 2. Power consumption depending on the type, flow rate, and pipeline parameters.
In graphs: 1- d = 0.315m, ρ = 1.2 kg/m3; 2 - d = 0.355m, ρ = 1.2 kg/m3; 3 - d = 0.4m, ρ = 1.2 kg/m3; 4 - d = 0.315m, ρ = 1,65 kg/m3; 5- d = 0.355m, ρ = 1,65 kg/m3; 6 - d = 0.4m, ρ = 1,65 kg/m3. Thus: 1.2 and 3 - with air movement of 4.5 and 6 - fuel mixture during the motion.
The graphs show that a significant portion of the power consumed for air transportation. Thus, when pipe diameter 0.315 m, a flow rate of 20 m/s is required to move the medium 16 kWt of power, and when the raw cotton in the medium increases to the power consumption of 25 kWt. Thus, 64% of the power consumed for air transportation.
At a speed of 30 m/s is required to move the air 40 kWt, and the mixture of air and raw cotton 85 kWt, or 48% corresponds to the air flow. With a diameter of 0.4 m, flow rate of 20 m/s is required to move the air 20 kWt, and the mixture of air and raw cotton 40 kWt. At a speed of 30 m/s is required to move the air 50 kW, and the mixture of air and raw cotton 110 kWt. Moreover, the power consumption is 50% and 46% of the total power consumption.
Increased power consumption for inclusion in the composition of raw cotton environmental obvious and objectively. The absolute increase in consumption can be estimated as: ΔN = Na - Nx. Here, Na – consumption (kWt) when driving fuel mixture; Nx - consumption for air movement. Figure 3 is a graph showing changes in the absolute increase in power consumption of the flow velocity in the pipe diameter 0.315 m and 0.4. The results also evident that at high speeds and at high conveying pipe sizes power costs will be considerably larger.
To determine the proportion of the power costs of air transportation and fuel mixture we use the formula:
ΔNн = (Na – Nх) / (0.01Na), (12)
Analysis of relationship (12) at flow rates (20 - 30 m / s) is shown in Fig. 4, which show that during the pneumatic transport of seed cotton over half power setting to move the spent air. At the same time, the share of power consumption for air transport at high flow rates is less than the lower, which is also obvious - to give the environment a large proportion of high speeds requires more effort than giving it a lower rate.
From the above we can conclude that the relationship (11) correctly describes the power consumption of the process of change of the flow parameters and the pneumatic installation as a whole and may be offered for use in the design of pneumatic conveying systems.
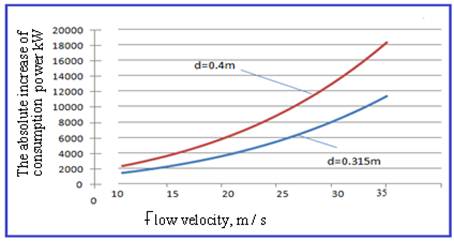
Fig. 3. The dependence of the absolute increase consumptionthe power of the flow velocity.
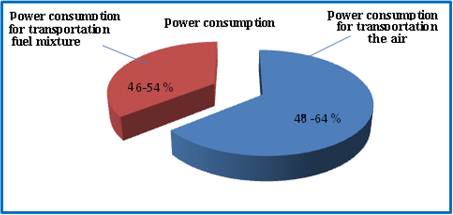
Fig. 4. Power consumption proportion of air transportation and fuel mixture.
4. Conclusions
(A) Research has established that the aerodynamic force that contributes to the displacement of the medium through the pipeline pneumatic transport installation depends on the total pressure of the flow, ie, the sum of the dynamic and static pressures.
(B) It was also found that the power expended in transporting the medium depends largely on the average flow rate, then the parameters from the (inner surface resistance, length and diameter) of the pipeline.
(C) Analysis of the results of studies power expended in transporting the medium indicates that an increase in power consumption flow rate increases markedly, with a considerable portion of the power consumed for air transportation.
(D) It was also found that the diameter of the pipe and the flow rate significantly affect the power consumption of the transportation environment, which leads to the conclusion that the use of smaller diameter pipes at moderate flow rates, thereby reducing power consumption and thus reduce production costs ginneries.
(E) Research results can be recommended to reduce the energy consumption used pipe diameters of 355 mm and 315 mm, instead of pipes of 400 mm diameter at a moderate rate of flow.
References


