Statistical Analysis of Effects of Extended UTAUT Variables on User Acceptance of Smart Wearable Devices and Use Behavior
Yoojin Moon
Faculty of Global Business & Technology, Hankuk University of Foreign Studies, Seoul, Korea
Email address
Citation
Yoojin Moon. Statistical Analysis of Effects of Extended UTAUT Variables on User Acceptance of Smart Wearable Devices and Use Behavior. American Journal of Computer Science and Information Engineering. Vol. 3, No. 3, 2016, pp. 16-22.
Abstract
The paper statistically analyzed effects of extended UTAUT (Unified Theory of Acceptance and Use of Technology) variables on user acceptance of smart wearable devices and use behavior on the empirical level. At this moment, looking at user intention to accept smart wearable devices would provide useful commercial and strategic implications. The PLS (partial least squares) structural equation model analysis showed that intention to use smart wearable devices depended on the level of performance expected by the consumer in utilizing smart wearable devices, on the hedonic experiences that the consumers enjoy, on the social influence that the consumer referents exert, and on the facilitating conditions available. Also it indicated that the actual use of smart wearable devices depended on the intention to use and the facilitating conditions available. For management and marketing strategies of smart wearable device providers, two factors of hedonic motivation and performance expectancy implied that consumers should experience the devices with enjoyment and get benefits by utilizing the devices. And the marketing strategies should appeal to consumers by positioning the device using experience as an adventure or a way to reduce their stress and change a negative mood. The area of smart wearable devices converged with IT and entertainment has high market growth potentiality.
Keywords
Smart Wearable Devices, Intention to Use, Performance Expectancy, Hedonic Motivation, Social Influence, Facilitating Conditions, Use Behavior
1. Introduction
Mobile systems are spreading around the world through wireless internet, while the smartphones are increasing connected with smart wearable devices. The smart wearable devices are recognized as a new trend in mobile applications. The smart wearable devices, which can be called a wearable computer, aim to supplement an individual’s physical ability and to use the devices without any inconvenience as if they are parts of one’s body. Different types of smart wearable devices exist as a clothing type and as an attachable type which can be worn on heads, fingers, and arms etc., and potential growth of the smart wearable devices is high all around the world. According to the user expectation studies regarding Koreans and Japanese, Koreans had more recognition and needs of wearable devises than Japanese and were more willing to buy wearable devices [1]. The health care area converged with IT and entertainment has high market growth potentiality, so looking at the user intention to use smart wearable devices would provide a useful commercial and strategic implication. Using the smart wearable devices is on the rise [2,3,4].
Smart wearable devices are related with the advanced technology, which is the core subject of the information technology acceptance theory [5,6,7,8,9,10]. The information technology acceptance theory is related to decision making of human’s willingness to accept new technology. So technology advancement studies include variables related to human attitude. This study sets the research model using the extended UTAUT (Unified Theory of Acceptance and Use of Technology) which integrates the existing theories.
UTAUT proposed by Venkatesh et al. includes three variables (performance expectancy, effort expectancy, and social influence) [11] that affect intention to use, one variable (facilitating conditions) [6] that affects usage behavior, and four controlled variables (sex, age, experience, and voluntariness) [12,13,14]. In addition to UTAUT variables, this study includes additional exogenous variables such as hedonic motivation and personal innovativeness [6] which become crucial when applying technology of smart wearable devices to UTAUT.
2. The Research Model and Hypotheses
2.1. The Research Model
The extended UTAUT provides an explanation for the acceptance and use of ICTs by consumers [12,13,14]. To explain the future intention to use the technology and the past and present use of the technology in organizational contexts, the UTAUT posits that performance expectancy, effort expectancy, social influence, and facilitating conditions affect intention to use the technology, and that intention to use and facilitating conditions influence the actual use of the technology. Fig. 1 provides two new constructs incorporated into the extended UTAUT: hedonic motivation and personal innovativeness [15,16]. The research model revises the definitions of the six constructs, taking into account the four previously cited constructs of the UTAUT together with two additional constructs, as illustrated in Fig. 1.
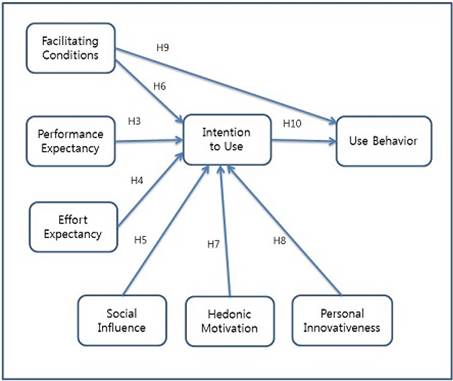
Fig. 1. The Research Model.
In this study, the extended UTAUT is applied to analyze acceptance and use of smart wearable devices by consumers. Table 1 shows operationalized definitions of constructs.
Table 1. Operationalized Definition.
| Constructs | Operationalized Definitions |
| Performance Expectancy | The degree to which using a new technology will provide benefits to consumers in utilizing smart wearable devices |
| Effort Expectancy | The degree of ease/effort associated with consumer use of smart wearable devices |
| Social Influence | The consumers perceive that important people (e.g. family or friends) believe that they
should use a particular technology |
| Facilitating Conditions | Consumer perception of the resources and support available to use smart wearable devices |
| Hedonic Motivation | Pleasure or enjoyment derived from using a new technology |
| Personal Innovativeness | The degree to which consumers search for and prefer use of smart wearable devices |
| Intention to Use | The degree of intention to use smart wearable devices in the future |
| Use Behavior | How often you use smart wearable devices |
2.2. Hypotheses Setting
Taking into account the relationships and constructs of the extended UTAUT, the following hypotheses are put forward in respect to smart wearable devices by consumers.
2.2.1. Demographic Variables
H1: Gender differences in performance expectancy, effort expectancy, social influence, facilitating conditions, hedonic motivation, personal innovativeness, and intention to use would exist.
H2: Differences in service experience would show different levels of performance expectancy, effort expectancy, social influence, facilitating conditions, hedonic motivation, personal innovativeness, and intention to use.
2.2.2. UTAUT Variables
H3: The performance expectancy in the use of smart wearable devices would positively affect intention to use smart wearable devices.
H4: The effort expectancy in the use of smart wearable devices would positively affect intention to use smart wearable devices.
H5: The social influence regarding the use of smart wearable devices would positively affect intention to use smart wearable devices.
H6: The facilitating conditions perceived in the use of smart wearable devices would positively affect intention to use smart wearable devices.
2.2.3. Additional Variables
H7: The hedonic motivation experienced in the use of smart wearable devices would positively affect intention to use smart wearable devices.
H8: The personal innovativeness regarding the use of smart wearable devices would positively affect intention to use smart wearable devices.
H9: The facilitating conditions perceived in the use of smart wearable devices would positively affect use behavior.
H10: The intention to use smart wearable devices would positively affect use behavior.
2.3. Samples and Data Collection
Non-probability samplings were made to select the samples, since the population size for this study was unknown. The samples were three groups: university students at C University in Seoul and D University in the southern region of Korea, and E public officers of F City. Just before questionnaires were distributed, those questioned were explained about current smart wearable devices specifically. They completed self-reported questionnaires and voluntarily participated in responding the questionnaires. From October 5, 2015 to October 25, 2015 the final questionnaire was administered to 300 individuals. The total number of questionnaires completed by the individuals surveyed was 229 (76.3% of the total surveyed), of which the total number of questionnaires available for the data analysis was 225 (75% of the total surveyed) after eliminating those questionnaires that had not correctly been completed.
Table 2 shows demographical statistics for the questionnaires. To define the demographics of respondents, a frequency analysis and a descriptive statistics analysis were performed based on a total of 225 samples. The analysis results for the participants are shown in Table 2. There were more males (58.2%) than females (41.8%). The largest proportion of the respondents (64.4%) was aged between 20 and 29. The largest proportion of the academic background (57.8%) was college students, followed by college graduates (30.7%). Most of the occupations (57.8%) were students, followed by public servants (33.8%). There were experienced users with smart wearable devices (16%).
Table 2. Demographical Statistics.
| Measure | Item | Frequency | (%) |
| Gender | Male | 131 | 58.2 |
| Female | 94 | 41.8 |
| Age | 20-29 | 145 | 64.4 |
| Others | 80 | 35.6 |
| Academic Background | College Students | 130 | 57.8 |
| College Graduates | 69 | 30.7 |
| Others | 26 | 11.5 |
| Occupation | Students | 130 | 57.8 |
| Public Servants | 76 | 3.8 |
| Others | 19 | 8.4 |
| Experience | Experienced Users | 36 | 16.0 |
| Non-Users | 189 | 84.0 |
3. Empirical Analysis
A regression analysis of latent variables was used in this research, based on the optimization technique of the partial least squares (PLS) to elaborate a model representing relationships between the eight proposed constructs measured by many items. The PLS as a multivariate technique to test the structural model estimates the model parameters to minimize the residual variance of the whole model dependent variables, does not require any parametric conditions, and is recommended for small samples [18,19,20,21,22].
The data analysis took place through a two-stage methodology. The first stage was to develop and evaluate the measurement model and the second stage was to develop the full structural equation model.
3.1. Reliability Analysis
The study verified reliability of the model using collected data (n=225). To measure the internal coherence of all the indicators in relation to the constructs, it tested reliability between multi-item scales on 22 measurement items using SPSS 18 program. The Cronbach coefficient α values are shown in Table 3. From the table, it is shown that the Cronbach coefficients α values are between 0.868 and 0.901, all bigger than 0.7, which is recommended for confirmatory research.
Table 3. Results of Reliability Analysis.
| Variables | Number of Items | Cronbach α | Standardized Cronbach α |
| Performance Expectancy | 3 | .873 | .883 |
| Effort Expectancy | 3 | .872 | .882 |
| Social Influence | 3 | .868 | .880 |
| Facilitating Conditions | 3 | .884 | .898 |
| Hedonic Motivation | 3 | .870 | .878 |
| Personal Innovativeness | 4 | .901 | .908 |
| Intention to Use | 3 | .868 | .883 |
3.2. Validity Analysis
The study performed the exploratory factor analysis about items of the questionnaire measuring constructs of the research model. A factor extraction method was based on principal component analysis and Varimax rotation with Kaiser-normalization [16].
As illustrated in Table 4, results of the exploratory factor analysis showed that all seven initially intended factors including a dependent variable were extracted: F1 ‘personal innovativeness’, F2 ‘performance expectancy’, F3 ‘facilitating conditions’, F4 ‘social influence’, F5 ‘intention to use’, F6 ‘hedonic motivation’, and F7 ‘effort expectancy’. Each factor showed that its Eigen value was above 1 and the rate of cumulative variance showed 84.807% of the total variance. This study found that multi-collinearity did not exist. Items measuring the same construct represented prominently higher factor loadings on a single construct than other constructs (indicated by boldface).
Table 4. Results of the Exploratory Factor Analysis.
| Factors | Item | F1 | F2 | F3 | F4 | F5 | F6 | F7 |
| Personal Innovativeness | V1 | .809 | .141 | .154 | .065 | .054 | .273 | .111 |
| V2 | .894 | .137 | .057 | .106 | .081 | .068 | .114 |
| V3 | .834 | .000 | .077 | .057 | .208 | -.004 | .131 |
| V4 | .735 | .043 | .203 | .181 | .047 | .119 | .357 |
| Effort Expectancy | V5 | .265 | .247 | .238 | .138 | .103 | .177 | .772 |
| V6 | .285 | .181 | .175 | .250 | .277 | .128 | .723 |
| V7 | .280 | .229 | .157 | .245 | .158 | .349 | .708 |
| Social Influence | V8 | .149 | .291 | .217 | .754 | .262 | .228 | .187 |
| V9 | .153 | .272 | .193 | .783 | .221 | .250 | .211 |
| V10 | .151 | .294 | .179 | .757 | .239 | .273 | .222 |
| Performance Expectancy | V11 | .087 | .787 | .189 | .270 | .264 | .218 | .204 |
| V12 | .113 | .765 | .138 | .278 | .274 | .222 | .190 |
| V13 | .131 | .783 | .187 | .236 | .235 | .243 | .208 |
| Hedonic Motivation | V14 | .124 | .329 | .175 | .277 | .286 | .669 | .212 |
| V15 | .169 | .216 | .183 | .240 | .226 | .798 | .197 |
| V16 | .214 | .266 | .238 | .286 | .248 | .718 | .226 |
| Facilitating Conditions | V17 | .165 | .161 | .839 | .186 | .108 | .040 | .156 |
| V18 | .091 | .198 | .781 | .193 | .116 | .296 | .178 |
| V19 | .157 | .078 | .811 | .075 | .256 | .140 | .116 |
| Intention to Use | V20 | .174 | .355 | .210 | .241 | .700 | .256 | .181 |
| V21 | .141 | .272 | .224 | .205 | .779 | .257 | .201 |
| V22 | .161 | .223 | .189 | .244 | .814 | .185 | .120 |
| Eigen Value | 3.25 | 2.79 | 2.62 | 2.61 | 2.58 | 2.48 | 2.33 |
| Explained Variance (%) | 14.770 | 12..699 | 11.885 | 11.855 | 11.719 | 11.287 | 10.592 |
| KMO (%) | 84.807 |
4. Hypotheses Verification
4.1. T-test Verification Regarding Gender and User Experience
As illustrated in Table 5, results of the T-test verification on samples showed that no statistically significant difference between genders existed at the level of α =.05. So H1 was rejected.
Table 5. Results of T-test between Genders.
| Levine’s Equal Variance | T-test on Identity of Mean |
| F | α | t | α |
| Personal Innovativeness | 4.508 | .036 | 1.043 | .299 |
| Effort Expectancy | .330 | .567 | .780 | .437 |
| Social Influence | 6.772 | .011 | -1.317 | .190 |
| Performance Expectancy | 2.457 | .120 | -.292 | .771 |
| Perceived Enjoyment | 8.592 | .004 | .401 | .689 |
| Facilitating Conditions | 1.972 | .163 | -.020 | .984 |
| Intention to Use | 5.935 | .016 | -1.015 | .312 |
Among six variables three variables - effort expectancy, hedonic motivation and intention to use - showed statistically significant differences between users and non-users at the level of α =.05, as shown in Table 6. So H2 was partially accepted.
Table 6. Results of T-test between Users and Non-Users.
| Levine’s Equal Variance | T-test on Identity of Mean |
| F | α | t | α |
| Performance Expectancy | .051 | .822 | 1.948 | .057 |
| Effort Expectancy | 1.194 | .276 | 3.798 | .000 |
| Social Influence | .002 | .967 | -1.466 | .149 |
| Facilitating Conditions | .089 | .766 | 1.525 | .134 |
| Hedonic Motivation | .005 | .941 | 3.432 | .001 |
| Personal Innovativeness | .359 | .550 | 1.921 | .061 |
| Intention to Use | .176 | .675 | 2.9425 | .007 |
4.2. Hypotheses Verification Using the Structural Equation Model
A PLS structural equation model analysis was performed to test H3 through H10. The regression parameters were based on a bootstrapping of 100 samples but not on a sample estimator, which facilitated the computation of the t-student for each hypothesis and generalization of the results. The results shown in Table 7 indicate relationship between the different constructs. All the R-squares are higher than .10, which means that the productive capability of the model is satisfactory.
Table 7. Summary of Test Results for the PLS Structural Equation Model.
| H | Path | ß | P- value | Accept | Construct | R2 |
| H3 | PE→IU | .308 | .000 | Yes | Intention To Use ------ Use Behavior | .652 -------- .610 |
| H4 | EE→IU | .028 | .683 | No |
| H5 | SI→IU | .184 | .009 | Yes |
| H6 | FC→IU | .126 | .021 | Yes |
| H7 | HM→IU | .227 | .001 | Yes |
| H8 | PI→IU | .056 | .261 | No |
| H9 | FC→UB | .250 | .001 | Yes |
| H10 | IU→UB | .367 | .000 | Yes |
Firstly, the results show that the main predictors of intention to use (IU), in the order of importance, are performance expectancy (PE), hedonic motivation (HM), social influence (SI) and facilitating conditions (FC). Therefore, H3, H5, H6 and H7 are accepted at the level of α =.05. That is, intention to use smart wearable devices depends on the level of performance expected by the consumer in utilizing smart wearable devices, on the hedonic experiences that the consumers enjoy when using the smart wearable devices, on the social influence that the consumer referents exert, and on the facilitating conditions available. However, in the hypothesized causal relationships of the proposed model, H4 and H8 are dismissed at the level of α =.05. That is, impact of effort expectancy (EE) on intention to use (IU) and that of personal innovativeness (PI) on intention to use (IU) are not supported.
Secondly, the results highlight that main predictors of actual use behavior (UB), in the order of importance, are intention to use (IU) and facilitating conditions (FC). Therefore, H9 and H10 are accepted at the level of α =.05. That is, it can be stated that the actual use of smart wearable devices (UB) depends on the intention to use (IU) and the facilitating conditions (FC).
Fig. 2 shows the results of the PLS structural equation model analysis.
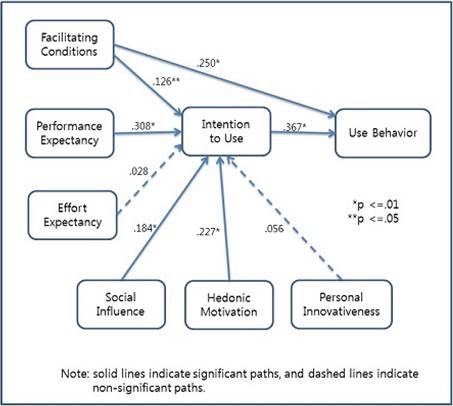
Fig. 2. Results of PLS Analysis.
5. Conclusions
The area of smart wearable devices converged with IT and entertainment has high market growth potentiality. At this moment, looking at the users’ intention to use smart wearable devices would provide a useful commercial and strategic implication. Based on results of this research, practical recommendation can be made to the providers of smart wearable devices regarding appropriate management and marketing strategies for improving key parts of their business model. This research explains how consumers behave regarding use of smart wearable devices. In particular, this research aims to analyze factors that influence both consumers’ intention to use and their actual use of smart wearable devices, for which a new adapted and extended version of the UTAUT is utilized.
The results show that the factor of facilitating conditions influences the intention to use and the actual use behavior, which coincides with the results of the previous studies [5,6,7,8,9,10,11,16,17] and contrasts with the findings obtained by others [12,13,14]. This means that consumer perceptions of supports and the resources for using smart wearable devices influence both intention to use and actual usage. Consequently, by making supports and resources available to customers the providers had better facilitate them to purchase the smart wearable devices, so that consumers can make access to the means necessary to resolve any problem that they may encounter during the using process.
Implications of the two factors of hedonic motivation and performance expectancy can be headed for the management and marketing strategies of smart wearable device providers, which means that consumers should experience the devices with enjoyment and get benefits by utilizing them. Thus, the smart wearable devices have to be elaborated in the pleasant and beneficial way. Marketing strategies should appeal to consumers by positioning the device using experience as an adventure or a way to reduce their stress and change a negative mood.
Social influences affect intention to use; a finding that coincides with the results from some studies [1,12,13,14,23] and contrasts with the findings from others [15,16], which means that consumers form intention to use because they imagine that their referents, such as friends, family and colleagues, think that they should use. Therefore, one of the marketing strategies for smart wearable devices should be reputation-building, in order to gain favorable opinions from referents, whether they are existing users or not, so that these persons can actively recommend using the devices to others.
Finally, the results indicate the effect of intention to use on use behavior: the greater the intention to use, the higher the probability of use behavior. Clearly, providers should aim to strengthen consumers’ intention to use, which will lead to actual use of the devices. Accordingly, they need to take action on particular variables like performance expectancy, hedonic motivation, social influence and facilitating conditions to increase the intention to use the devices.
Future studies should examine that the model proposed can be applied for other kinds of smart products and services. Also it would be of interest to analyze the possible cross-cultural differences in the determinant factors that influence consumers in their intention to use and their actual use of smart wearable devices. In addition, influence of social demographic variables as moderator variables might be examined. And it would be helpful to conduct a longitudinal analysis to determine how these variables change over time.
Acknowledgements
This work was supported by Hankuk University of Foreign Studies Research Fund of 2015.
References
- Son H, Lee S, Cho M (2014) Influential factors of college students’ intention to use wearable devices: An application of the UTAUT2 model. Korean Journal of Communication and Information 68: 7-33.
- Takuji S, Hirokazu T, Shigenobu M, Hiroshi Y, Takashi M (2013) Wearable wireless vital monitoring technology for smart health service. In: 2013 7th International Symposium on Medical Information and Communication Technology (ISMICT): 1-4.
- Ishaq I, Hoebeke J, Rossey J, Poorter ED, Moerman I, Demeester P (2014) Enabling the web of things facilitating development, discovery and resource access to IoT objects using embedded web services. International Journal of Web and Grid Services 10 (2/3): 218-243.
- Moon Y, Hwang Y, Min K (2015) Factors influencing acceptance of smart health care services. In: World Congress on Information Technology Applications and Services: 1.
- Wallace LG, Sheetz SD (2014). The adoption of software measures: A technology acceptance model (TAM) perspective. Information & Management 51: 249-259.
- Agarwal NK, Wang Z, Xu Y, Poo DCC (2007) Factors affecting 3G adoption: An empirical study. In: 11th Pacific-Asia Conference on Information Systems: 255-270.
- Baek SY (2009) In search of Moderators in the technology acceptance model with meta-analysis. Korean Management Review 38 (5): 1353-1380.
- Davis FD (1989) Perceived usefulness, ease of use, and the user acceptance of information technology. MIS Quarterly 13 (3): 318-581.
- Martins C (2013) Exploring digital music online: User acceptance and adoption of online music services. Instituto Superior de Economia Gestao.
- Porter CE, Donthu N (2006) Using the technology acceptance model to explain how attitudes determine Internet usage: The role of perceived access barriers and demographics. Journal of Business Research 59: 999-1007.
- Venkatesh V, Morris MG, Davis GB, Davis FD (2003) User acceptance of information technology: Toward a unified view. MIS Quarterly 27 (3): 425-478.
- Lescevica M, Ginters A, Mazza R (2013) Unified theory of acceptance and use of technology (UTAUT) for market analysis of FP7 CHOReOS products. Procedia Computer Science 26: 51-68.
- Venkatesh V, Thong JII, Xu X (2012) Consumer acceptance and use of information technology: Extending the unified theory of acceptance and use of technology. MIS Quarterly 36 (1): 157-178.
- Zhou T, Lu Y, Wang B (2010) Integrating TFT and UTAUT to explain mobile banking user adoption. Computers in Human Behavior 26 (4): 760-767.
- Parameswaran S, Kishore R, Li P (2015) Within-study measurement invariance of the UTAUT instrument: An assessment with user technology engagement variables. Information & Management 52 (3): 317-336.
- Escobar-Rodriguez T, Carvajal-Trujillo E (2014) Online purchasing tickets for low cost carriers: An application of the unified theory of acceptance and use of technology (UTAUT) model. Tourism Management 43: 70-88.
- Hwang Y, Hwang W, Moon Y (2012) A study of factors influencing intra-organizational potential users’ intention to use N-screen service. KCGR 16 (1): 89-114.
- Anderson JC, Gerbing DW (1988) Structural equation modeling in practice: A review and recommended two-step approach. Psychology Bulletin 103 (3): 411-423.
- Baggozzi RP, Yi Y (1988). On the evaluation of structural equation models. Journal of the Academy of the Marketing Science 16 (1): 74-94.
- Fornell C, Larcker DF (1981) Evaluating structural equation models with unobservable variables and measurement error. Journal of Marketing Research 18 (1): 39-51.
- Hair JF, Anderson RE, Tatham RL, Black WC (1998) Multivariate analysis. Prentice Hall International, Englewood.
- Nunnally J (1978) Psychometric theory. McGraw-Hill series in psychology.
- Aizstrauta D, Ginters E, Eroles MP (2015) Applying theory of diffusion of innovations to evaluate technology acceptance and sustainability. Procedia Computer Science 43: 69-77.