Life Cycle Assessment of Domestic Wastewater in a Neighborhood with Spontaneous Housing - a Case Study of Bonamoussadi, Yaoundé-Cameroon
Elime Bouboama Aimé1, Mamba Mpele2, Tsimi Ngah Inès3
1Mechanical Engineering, National Advanced School of Engineering, University of Yaoundé I, Yaounde, Cameroon
2Civil Engineering, National Advanced School of Engineering, University of Yaoundé I, Yaounde, Cameroon
3Mechanical Engineering, National Advanced School of Engineering, University of Yaoundé I, Yaounde, Cameroon
Email address

(E. B. Aimé)

(M. Mpele)

(T. N. Inès)
Citation
Elime Bouboama Aimé, Mamba Mpele, Tsimi Ngah Inès. Life Cycle Assessment of Domestic Wastewater in a Neighborhood with Spontaneous Housing - a Case Study of Bonamoussadi, Yaoundé-Cameroon. American Journal of Civil and Environmental Engineering. Vol. 1, No. 1, 2016, pp. 1-18.
Abstract
This work is about the life cycle assessment (LCA)1 of the effluents of a spontaneous housing neighborhood. Effluents refer to gray water (domestic), surface water (rainwater) and faeces. In this document, we are particularly interested in waste sludge from independent sanitation systems (ISS)2. After a presentation of the LCA methodology, a case study on effluents from an ISS2of the Bonamoussadi neighborhood was carried out. The case of the EcoSan latrine, which does not exist in the neighborhood, was considered, with a view to manage the effluents better. The various systems that were studied reveal that, the traditional shallow latrine that is often drained into the river is the most polluting. The EcoSan latrine is the most polluting device for the majority of indicators, except for water and eco-toxicity indicators. However, the EcoSan latrine has an environmental benefit when sludge is exploited in the agricultural sector. The environmental impacts of sanitation devices differ according to the various phases of the life cycle. Thus, the phase of construction impacts energy, resources, water, waste and radioactive waste and odors. The exploitation and maintenance phase has impacts characterized by toxicity, eco-toxicity, acidification, global warming potential (GWP)3, eutrophication and smog.
Keywords
Life Cycle Assessment, Sanitation Device, Spontaneous Housing in Cameroon, Dehydration Room, Decision-Making Aid
1. Introduction
At global level, sanitation problems are gaining considerable importance, considering the challenges of sustainable development and environmental protection. In order to reduce poverty in the world, and cognizant of pollution induced by poor sanitation conditions, the MDGs4 were set up, with the aim, among other things "to ensure a sustainable environment by reducing the proportion of people having no access to improved sanitation". Developing countries are the main target for the achievement of this MDG4. In Cameroun, the proportion of people having no access to improved sanitation in urban areas is reducing, from 65% in 1990 to 52.4% in 2010 [1]. This decline is closely related to the expansion of spontaneous housing estimated at 5.5% [2].
1 life cycle assessment; 2 autonomous sanitation device; 3 global warming potential; 4 objectives of the millennium for development; 5 pit latrine; 6 septic tank; 7 manual flush latrine; 8 chemical oxygen demand; 9 nitrogen total kjeldhal
In the neighborhoods with spontaneous housing, about 75% of the Yaounde population, sanitation conditions are more precarious [1]. Sanitation here is mainly autonomous and consists to 85% of pit latrines [3]. In order to improve these conditions, the national liquid sanitation strategy envisages informing the population on the advantages and disadvantages of some improved devices of sanitation whose construction can be subsidized to reduce by half the rate of access to a non-improved sanitation.
However, this information strategy does not take the potential environmental impacts into account due to the use of these systems. Similarly, no legal instrument indicates which system is the best as regards environmental impacts. Thus during the last years, several authors used the LCA method to know the environmental impacts of various types of sludge treatment. LCA approach can be used for comparing alternative wastewater treatment processes for typed communities (Machado AP, et al. Water Sci technol. 2007). David Godin (2012) used the LCA1 to assess the potential impact of releasing wastewater without and with treatment besides assessing the impact of the WWTP’s life cycle (Sainte Marie, QUEBEC). A review of 45 papers dealing with LCA and wastewater has been conducted (LI. Corominas et coll, October 2013.) and reveal a variability in the approaches. As a result of this review, guidelines are needed for water treatment LCA studies so methodologies have to be updated to account for upcoming challenges in the water treatment field. But, such studies were not carried out in the context of central Africa, and also did not concern the independent sanitation devices.
Our purpose is to apply a method of general assessment of environmental impacts to the various independent sanitation devices. The LCA carries out a detailed and quantitative assessment of inflows and outflows of a system which can be a process, a product or a service. Thus each stage of the system’s life cycle consumes nonrenewable energy and resources and/or emits polluting substances. The environmental impact of these emissions is characterized by impact indicators and is calculated using flows of materials. The LCA is a multi-criterion methodology because it allows for the calculation a great variety of indicators. The major stake of using the LCA is to identify the independent sources of environmental impacts and to avoid or, if necessary, to manage pollution displacements related to the various alternatives considered. The ISO 14040 standards series entirely defines the framework for the realization of a LCA and according to four main stages:
• the definition of the objectives and fields of the study
• the inventory of the life cycle
• the assessment of the impact
• the interpretation of results
The LCA clearly shows that after assessing the various impact indicators, the decision maker can make a strategic choice as regards the sanitation policy to be adopted for a neighborhood with spontaneous housing. In this article, we apply LCA to assess the potential environmental impact of independent sanitation devices found in a spontaneous housing neighborhood in Yaoundé. Inventory and characterization of different types of devices named here scenarios have been done followed by the determination of local impact factors and calculation of general impact factor for each device, following twelve impact categories. At the end, a comparative analysis based on the general impact factors found was carried out to state on the less polluting sanitation device.
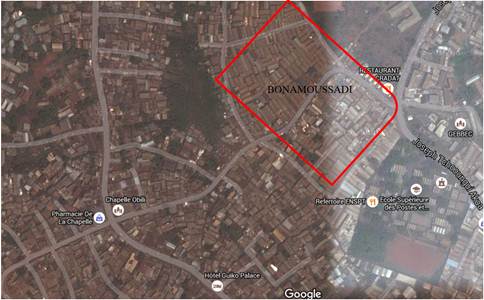
Figure 1. Satellite image of the Bonamoussadi neighborhood.
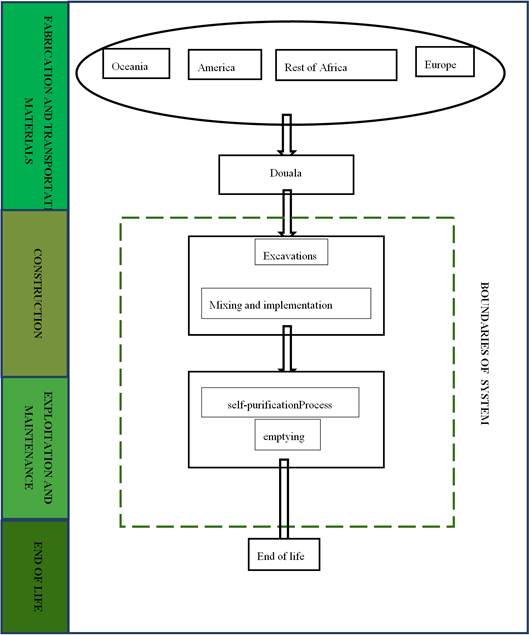
Figure 2. System boundaries. For the study, we will only consider two stages of the life cycle, device construction, exploitation and maintenance. The transportation of materials and the fabrication process will not be considered in the study.
2. Material and Methods
2.1. Objective and Scope of the Study
2.1.1. Objective
The objective of this study is to determine, using a comparative LCA, the sanitation device most adapted in a neighborhood with spontaneous housing, taking into consideration environmental requirements.
2.1.2. Location
We will apply LCA method to the sanitation devices of the Bonamoussadi neighborhood with spontaneous housing. This neighborhood is located in Yaoundé, 3rd District, longitudes 11°29' 18,2'' to 11°29' 56,4'' and latitudes 3°51' 2,88'' to 3°51' 7,2''. It is mainly a students’ residential area, around the University of Yaoundé 1 as well as other advanced schools (National Advanced School of Posts and Telecommunications and others).
The Bonamoussadi neighborhood is built on a steep slope and is bordered downwards by a stream (Olezoa) which starts from there.
2.1.3. Structure of the Life Cycle
The study of the life cycle of systems whose main function is waste treatment constitutes a special case of system which requires tackling both the life cycle of waste to be treated as well as the life cycle of the associated process, since the environmental impacts of the service and the product are interdependent. As a matter of fact, the service impacts the quality of the product upstream of the system and influences the performances of treatment. Taking into account simultaneously account of the two life cycles is then shown on figure 3 below:
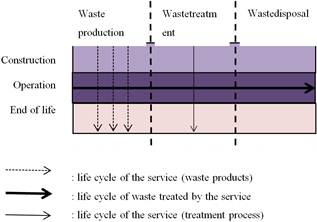
Figure 3. Structure of life cycle. This represents the common structure of the life cycle of a treatment process .
2.1.4. Boundaries of the System
We will only consider the construction, exploitation and maintenance phases of the system (figure 2).
2.1.5. Independent Sanitation Systems Found in the Neighborhood
A survey was carried out in the various households with the purpose of finding out which types of is there used, the modes of exploitation of the devices and the maintenance activities by the users. This survey revealed that 62% of the households use the pit latrines, 33% manual flush latrines and 25% septic tanks. As far as evacuation is concerned, 12%use trucks, and 25% manual pumps or shovels. All the latrines located close to the river are emptied manually into the river, generally when it’s raining (48%). 10% of the systems have never been drained, and these are mainly pit latrines. Once full, they are sealed and a new latrine is built. Some households (5%) build their latrines directly at the edge of the stream (latrines with manual flush) and dejections are directly drained into the river, without using a retention pit.
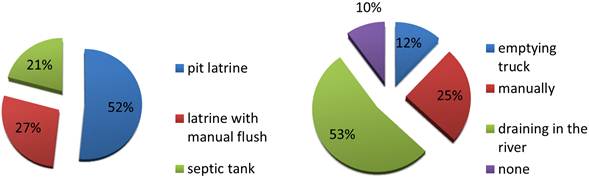
Figure 4. Results of household survey.
2.1.6. Choice of Study Scenarios
A scenario shows the structure of the life cycle for each system retained for the study. Scenarios are selected on the basis of two main criteria:
• A good knowledge of the whole life cycle: as a matter of fact, to determine the environmental impact of the life cycle, it is necessary to have a good knowledge of the life cycle of the service. This guarantees the admissibility and the comparability of results. The environmental impact of some basic life cycle processes such as emptying with trucks is not fully known; it requires another LCA1. Thus sanitation systems with complex and unknown life cycle structures will not be taken into account in the study.
• a comparative study of some sanitation devices. This comparison allows evaluating the performance of the systems based on several criteria.
The following table illustrates the comparison of some well-known ISS2found in the Cameroon liquid sanitation strategy.
Table 1. Comparison of some ASD according to some performance criteria.
| PL5 | ST6 | MFL7 | VIP8 | EcoSan |
| emptying (manually=1, without health hazard =1) | 01 | 00 | 01 | 01 | 11 |
| Insects (absent=1) | 0 | 1 | 1 | 1 | 1 |
| Odours (absent =1) | 0 | 1 | 1 | 1 | 1 |
| Sealing (good =1) | 0 | 1 | 0 | 0 | 1 |
| Water (use=0) | 1 | 0 | 0 | 1 | 1 |
| construction Cost (high=0; average=1; low =2) | 2 | 0 | 1 | 1 | 1 |
| TOTAL | 4 | 3 | 4 | 5 | 7 |
With a view to managing the effluents better, it is noted that in light of the above-mentioned performance criteria, the EcoSan latrine proves to be the most adapted to the neighborhoods with spontaneous housing. The following scenarios were retained in our study:
• Scenario A
This is the most represented scenario in the site of study. The system is a shallow pit latrine. It is primarily used to cleanse excreta. When the latrine is full or during the rainy season, it is drained towards the river.
• Scenario B
This is a latrine built for manual flush. However it is not equipped with a retention pit so that when excreta are produced, they are directly evacuated towards the stream. They are commonly called gun latrines.
• Scenario C
This is a conventional pit latrine (very deep). When the latrine is full, it is sealed and another is built just near.
• Scenario D
This scenario shall deal with the dehydration room. At the time of our investigations, we found no household using this kind of system. But taking into account the adequacy of the device with this type of neighborhood, we found it appropriate to evaluate it at the environmental level.
However it should be noted that the sanitation scenarios selected are not the only ones in use in Bonamoussadi, but those that respect the above-mentioned selection criteria.
2.2. Life cycle Inventory
The inventory will be done for each scenario presented earlier; it will be done for the construction and exploitation stages of life cycle.
2.2.1. Construction Stage
• Scenario A
The latrines are of traditional type, not very deep because of the high level of the water table. They are provided with a PVC pipeto facilitates draining when sludge reach a critical level, or during the rainy season.
Most of them are built on 1.5 to 2m depth, of generally rectangular shape of 1´1 m2 dimensions. With a flagstone is placed with an opening allowing the passage of excreta into the system. A sustaining wall is built right underneath to prevent the collapse of the flagstone and the superstructure. The flagstone is directly laid on the top. Given the marshy nature of that area, masonry work is done thoughout the entire depth of the pit. The bottom of the pit is not masoned to allow the infiltration of fluids into the ground.
The flagstone is 8cm thick, and a surface of 1m2; the first two rows of concrete blocks are stuffed with mortar, in place of a wall tie.
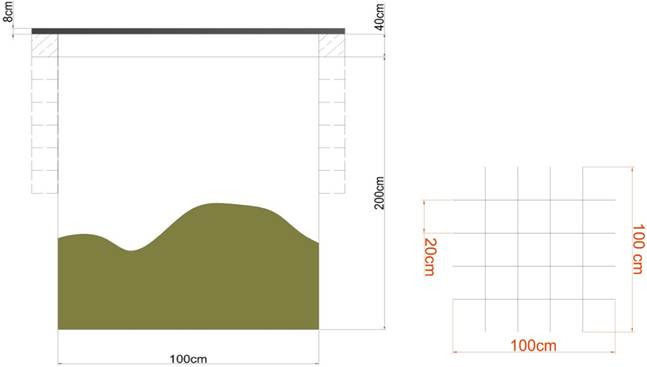
Figure 5. Model of scenario A-dimensioning a shallow pit latrine.
• Scenario B
This is known as "gun latrine". It works with a manual flush which makes it possible to evacuate excreta directly towards the stream. It has no pit.
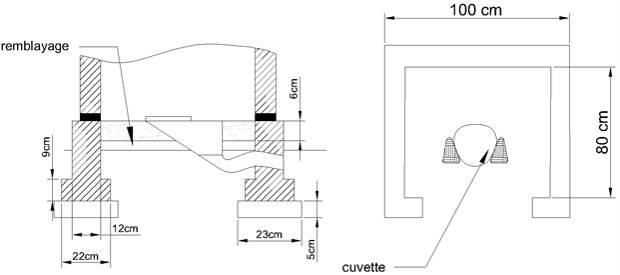
Figure 6. Model of scenario B-dimensioning a manual flush latrine.
• Scenario C
This is a traditional deep pit latrine. It is generally very deep (>5m). It can last up to 20 years, and when it is full it is sealed and abandoned. The inner part of the latrine is not masoned. Two rows of concrete blocks stuffed with mortar are placed just beneath the flagstone to prevent it from collapsing.
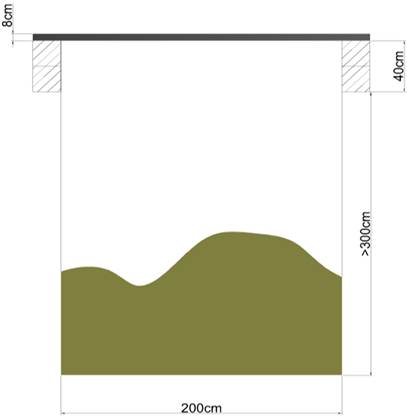
Figure 7. Model of scenario C-dimensioning a deep pit latrine.
• Scenario D
This is a dehydration room. It is conceived so that faeces are stored in a pit and urine is diverted outside into a tank. The dehydration room is designed initially with two separate pits, while one is used, the other is closed. When first is full, it is put out of service and the second is put into service. It is provided with a ventilation system to evacuate gases and anti-flies netting.
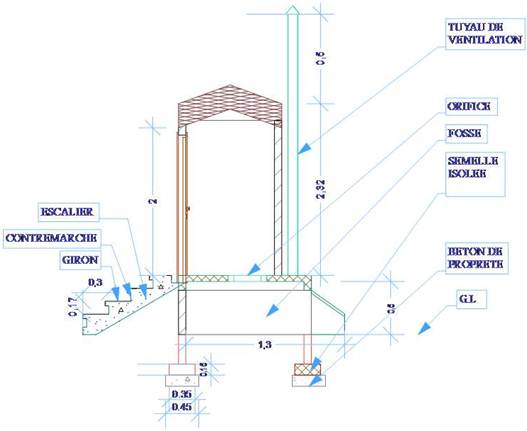
Figure 8. Scenario D model -dimensioning a dehydration room.
The following table summarizes the construction phase for each scenario
Table 2. Summary of construction inventory.
| Flux | Scenario A | Scenario B | Scenario C | Scenario D |
| Concrete pavement/base (m3) | 0.080 | 0.075 | 0.080 | 0.2695 |
| Concretepillars (m3) | 0.000 | 0.030 | 0.000 | 0.074 |
| Formwork (m3) | 0.080 | 0.105 | 0.082 | 0.345 |
| Sealingcoat (m3) | 0.000 | 0.011 | 0.000 | 0.011 |
| Breeze blocks | 71.000 | 0.000 | 19.000 | 72.000 |
| Excavations (m3) | 2.000 | 0.000 | 5.000 | 0.000 |
| Mortar for agglo (m3) | 0.057 | 0.000 | 0.057 | 0.091 |
| Coating (m3) | 0.000 | 0.000 | 0.000 | 0.288 |
| PVC (m2) | 0.000 | 0.000 | 0.000 | 0.300 |
2.2.2. Inventory of Exploitation and Maintenance Stages
Once the sanitation system is built, it is put at the disposal of users. The exploitation of the system includes all the activities implemented to ensure its maintenance, to maintain sludge treatment process, and to allow sludge rejection into nature, in conformity with regulations in force. The inventory of the exploitation phase will take into consideration, for each scenario, inflow and outflow of matters which play a determining role in the maintenance of the system and the sanitation process.
The inventory of inflows comprises all matters and products necessary for the use of the system. Outflows represent all of the pollutants discharged into nature.
In our case study, no substance is necessary for the use of the system except for scenario B which requires the use of water to evacuate excreta. All of the pollutants discharged into nature are mainly gases produced during the degradation of sludge, as well as sludge polluting loads rejected into nature as waste.
The polluting substances generally found in theISS2 effluents and taken into account in the LCA1 are the following: organic matters in the form of COD9, nitrogen, phosphorus and heavy metals. The determination of these parameters is done through the sampling of sludge on site and laboratory tests. In order to get values which reflect best the situation, we took a sludge sample on the surface and at the bottom of each type of sanitation system. We also took two samples, during the dry season and the other during the rainy season. The tests were carried out in the laboratory of Biochemistry of the University of Yaoundé I. The parameters to be detected were the following: COD9, NTK10, Pt11, Pb, Cd, Zn. Some parameters generally found in excreta [4] could not be analyzed due to the absence of the necessary equipment in the laboratory (B, Cu, Ni, Hg). The results obtained are the following:
Table 3. Laboratory results. The samples were taken from two devices, and for each device we took one at the top and the other at the bottom.
| Parameters | Surface of the latrine | Bottom of the latrine |
| 1 | 2 | 1 | 2 |
| DCO (mg/l) | 12170 | 13413 | 7408,3 | 8836,56 |
| NTK (mg/l) | 1300 | 1686 | 1231 | 1400 |
| Pt (mg/l) | 29.4 | 20.8 | 27.5 | 18.72 |
| Pb (mg/l) | 18.06 | 3.5 | 17.35 | 2.1 |
| Cd (mg/l) | 6.78 | 0.83 | 7 | 1.6 |
| Zn (mg/l) | 33 | 8.8 | 22.73 | 7.6 |
It can be noted that for all the parameters, the concentration decreases as we get near to the bottom of the latrine. This could be explained in three ways [5]: part of substances present in the form of ions is absorbed by the ground through the phenomenon of leaching; the other part is evacuated from the latrine in the form of gas. It is the remaining part that is found in sludge located at the bottom of the latrine. There is a light difference between the two latrines, depending on the type of use. For latrines of ease, the COD9 and NTK10 are high. This might be due to the fact that in the other latrine, these parameters are diluted in the bathing water. On the other hand, the Pt11 concentrations, Cd, Pb, Zn are weaker in latrines of ease. This can be justified by the fact that these parameters are present in little quantities in excreta, but more present in gray water [4]. Also, the physico-chemical parameters vary according to the metabolism and the diet of each individual.
However these results are very far away from the established values relating to the content of excreta at the exit of the human body:
Table 4. Chemical characteristics of excreta.
| Parameters | [4] | [6] |
| COD (g/l) | - | 32,3 |
| Nt (g/l) | 10.7 | 8.22 |
| Pt (g/l) | 0.94 | 1.1 |
| Zn (mg/l) | 8.7 | - |
| Pb (mg/l) | 0.3 | - |
| Cd (mg/l) | 0.087 | - |
There is considerable difference between the parameters obtained after analyses and those from literature. This is completely understandable, since between the time of defecation and that of sampling, several biochemical processes occur, thus modifying the initial characteristics of excreta.
For life cycle inventory, we shall retain the values obtained after analyzing samples of heavy metals. As concerns the other parameters, we shall calculate the average of values in table 4.
Table 5. Chemical parameters of excreta retained for the study.
| Parameters | Surface latrine | bottom of the latrine |
| COD (g/l) | 32.3a | 8.123b |
| NTK (g/l) | 9.45a | 1.32b |
| Pt (g/l) | 1.02a | 0.0232b |
| Pb (mg/l) | 10.78b | 9.725b |
| Cd (mg/l) | 3.4815b | 4.3b |
| Zn (mg/l) | 20.9b | 30.33b |
a= average of the table 4; b= average of the table 3
• Scenario A: the values of the preceding table will be entirely used for the determination of outflowing matter.
• Scenario B: In this case, we shall use the values of the preceding table (surface of the latrine) in the determination of outflows. The quantity of water necessary for the evacuation of excreta will be given by means of household investigation.
• Scenario C: The values of the preceding table (surface of the latrine) will be re-used in this section.
• Scenario D: Outflowsshall constitute the polluting loads emitted in the natural environment. For this purpose, it will be necessary to characterize urines and dry faeces from the system. Consequently we shalltake the values of literature into consideration [6]:
Table 6. Volume and composition of excreta.
| | Urines | Faeces |
| Volume (L/pers/yr) | 500 | 50 |
| DCO (kg/pers/yr) | 3.6 | 14.1 |
| NTK (kg/pers/yr) | 4 | 0.55 |
| P (kg/pers/yr) | 0.4 | 0.18 |
For heavy metals, we shall use the same values as in the other scenarios (surface of the latrine).
We obtain the summary table for exploitation and maintenance phases for each scenario:
Table 7. Summary of exploitation and maintenance stages inventory.
| Flow (kg) | Scenario A | Scenario B | Scenario C | Scenario D |
| water | ground | Air | Air | water | Air | ground | Air | ground |
| CH4 | 0.000 | 0.000 | 1.011 | 0.808 | 0.000 | 5.653 | 0.000 | 35.250 | 0.000 |
| N2O | 0.000 | 0.000 | 0.085 | 0.075 | 0.000 | 0.075 | 0.000 | 0.003 | 0.000 |
| NH3 | 0.000 | 0.000 | 4.370 | 3.811 | 0.000 | 3.811 | 0.000 | 3.811 | 0.000 |
| COD | 8.130 | 0.000 | 0.000 | 0.000 | 32.300 | 0.000 | 32.308 | 0.000 | 0.000 |
| NTK | 1.320 | 5.653 | 0.000 | 0.000 | 9.450 | 0.000 | 9.451 | 0.000 | 8.276 |
| Pt | 0.000 | 1.021 | 0.000 | 0.000 | 1.022 | 0.000 | 1.022 | 0.000 | 2.191 |
| Pb. 10-3 | 9.725 | 10.784 | 0.000 | 0.000 | 10.78 | 0.000 | 10.780 | 0.000 | 10.782 |
| Cd. 10-3 | 4.315 | 3.482 | 0.000 | 0.000 | 3.482 | 0.000 | 3.482 | 0.000 | 3.486 |
| Zn. 10-3 | 30.33 | 20.901 | 0.000 | 0.000 | 20.905 | 0.000 | 20.911 | 0.000 | 20.900 |
| Eau | 0.000 | 769.231 | 0.000 | 0.000 |
2.3. Evaluation of the Environmental Impacts
2.3.1. Classification of Flows According to the Category of Impact
In environmental assessment, twelve categories of impact are usually used. Each category is characterized by an indicator, and each indicator is associated with factors of impact.
Thus, for a chosen indicator, we associate the whole of matter flows which contribute to it. The table below gives the classification of some flows:
Table 8. Classification of matter flows.
| Indicators | Flow selected |
| Primary energy | Wood. coal. oil. natural gas. energy |
| Exhaustion of resources | Wood; coal, oil, natural gas, lignite, clay, limestone, chloride potassium, sodium chloride, gravel,
kaolin, sand, steel, rubber |
| Water consumption | Water |
| Waste | Solid waste. Toxic waste |
| Radioactive waste | Potassium, sodium chloride, chloride, money, aluminum, cobalt. Copper, tin, magnesium,
manganese, mercury, nickel, gold, platinum. Lead, silica, suffers, barium sulfate, titanium, zinc. |
| Greenhouse effect | CO2. CFC. N2O. CH4 |
| Acidification | NO. Nox. SO2. NH3 |
| Eutrophication | Nitrogenize and nitrogenized ions. phosphorus phosphates. DCO. NH3 |
| Ecotoxicity | Hydrocarbons, carbon monoxide, nitrogen oxides, ammonia, sulfur dioxide, sulfurous hydrogen,
chlorinated compounds, fluorinated compounds, arsenic, chromium, cobalt, copper, tin;
manganese, mercury, nickel, lead, tellurium; zinc |
| Human toxicity | Cyanide, hydrocarbons, arsenic and its compounds, chromium plate and its compounds, copper
and its compounds, tin and its compounds, mercury and its compounds, nickel and its compounds; lead and its compounds, zinc and its compounds, NH3 |
| SMOG | NO. NO2. SO2. CH4. N2O. C2H4. |
| Odour | COV |
2.3.2. Impact Factors
Several formulas for the determination of factors of impact were established and consequently, empirical values were given. However, it’s worth to note that these values are dependent on the environmental conditions, also depending on the socio-economic realities of the areas for which they were established.
However, there is a database of factors of impacts recognized at international level: the ECOIVENT database. It is a well-stocked database, but which is unfortunately adapted only for the countries with temperate climate, with some advanced economic development. Thus, this database cannot be used in our case study.
However, we note that the standards of rejection into nature are dependent of the type of medium and their determination is similar to those of the factors of impact. Thus we decide to confront the standards of rejection in Cameroun and those of Canada and there was a sharp difference. Supposing that the creation of a link between the Canadian and Cameroonian standards of rejection will imply the re-use of the same link between the factors of impact of the same countries, a ratio between the various values is established as follows:
 (1)
(1)
where:
Ncmr=Cameroonian standards;
Nca= Canadian standards;
Fcmr= factor of impact for Cameroun
Fca= factor of impact for Canada
For each substance considered, this formula will be use to determine the associated factor of impact. The factors of impact of basic components [7] and processes of construction [8] as well as some chemicals matters are shown in the tables below:
Table 9. Database of building site processes.
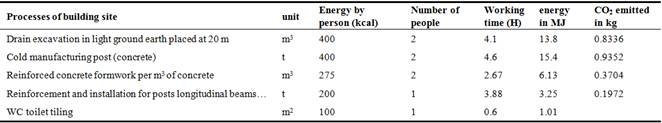
Table10. Database of the basic components.
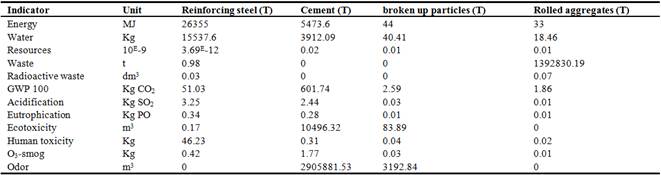
Table 11. Continued.
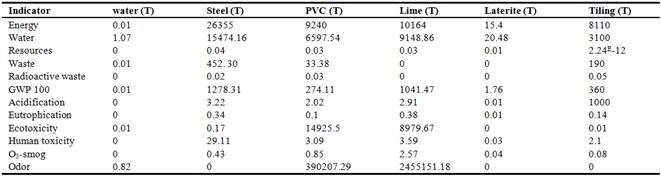
Table 12. Database of heavy metals and some chemical substances.
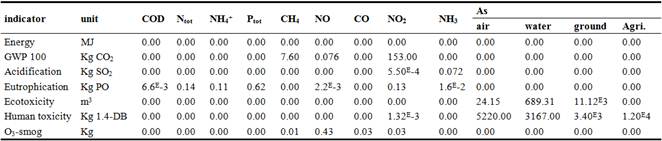
Table13. Continued.
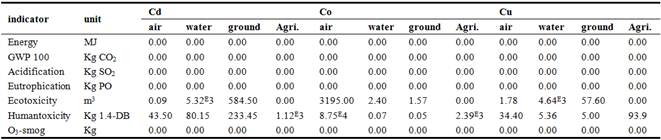
Table 14. Database heavy metals and some chemical substances.
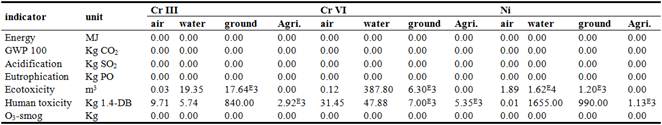
Table 15. Continued.
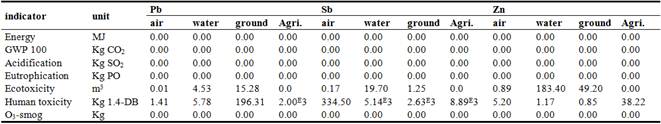
Table 16. Database for the manufacture off mixtures.
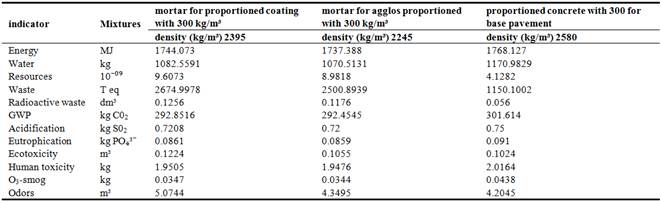
Table 17. Continued.
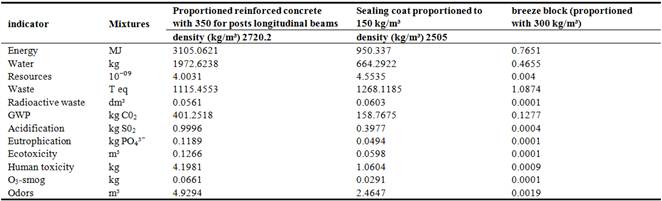
* Factors are related to production
3. Theory/Calculation
3.1. Gas Flow
On the basis of the physico-chemical parameters, we can deduce the flow of gas produced by the system. Gases generally taken into account are methane, ammonia and nitrous oxide.
The reference flow of methane is given by the following formula:
 (2)
(2)
With
Co= maximum capacityofproductiondeCH4; Co= 0.25 kg CH4/kg COD [9]
CCMi= correction coefficient for the methane or portion of degraded anaerobic COD in a system [9]
The reference flow of nitrous oxide is given by the following formula:
 (3)
(3)
Where:
XN= total nitrogen flow
 = emission factor for the emissions ofN2Oresulting from rejected waste water. N2O - N kg/kg N. equal to 0.005 kg N2O-N/kg N by defect [9]
The reference flow of ammonia is given by the following formula:
 (4)
(4)
XN= total nitrogen flow
= emission flow for the emissions of NH3 resulting from rejected waste water NH3 - N kg/kg N. equal to 0.258 kg NH3-N/kg N by defect [10]
The 44/28 factor is the conversion of N2O -N kg in N2O kg.
3.2. Calculation of Environmental Impact Factors
For a given substance k. the factor of impact related to this emission is given by:
 (5)
(5)
Where Xk is the reference flow of the substance k
fecoivent is the factor of impact of the substance in the ecoivent database
The total factors of impact of the treated scenarios are obtained with the following formula:
 (6)
(6)
Where
i the considered impact category.
Fi the characterization factor of the whole life cycle for category i.
Cαik factors contributing to impact i for phaseα of life cycle.
4. Results
4.1. Impact Factors Values
The impact factors are given in the following tables:
Table 18. Summary of impacts factors according to the stages of the life cycle.
• Scenario A
| Indicator | Unit | Construction | Exploitation/disposition | Total |
| Energy | MJ | 322.431 | 0.000 | 322.431 |
| Water | kg | 187.745 | 0.000 | 187.745 |
| Resources | 10ˉ⁰⁹ | 1.120 | 0.000 | 1.120 |
| Waste | T eq | 311.761 | 0.000 | 311.761 |
| Radioactive waste | dm³ | 0.015 | 0.000 | 0.015 |
| GWP | kg C02 | 51.604 | 20.690 | 72.294 |
| Acidification | kg S02 | 0.123 | 3150.468E-4 | 0.439 |
| Eutrophication | kg PO₄³⁻ | 0.016 | 0.760 | 0.776 |
| Ecotoxicity | m³ | 0.018 | 31710.55E-3 | 31.729 |
| Human toxicity | kg | 0.333 | 3383.912E-3 | 3.723 |
| O3-smog | kg | 0.007 | 8.48E-3 | 1.245 |
| Odors | m³ | 0.720 | 0.000 | 0.720 |
• Scenario B
| Indicator | Unit | Construction | Exploitation/disposition | Total |
| Energy | MJ | 236.254 | 0.000 | 236.254 |
| Water | kg | 66.510 | 769.231 | 835.741 |
| Resources | 10ˉ⁰⁹ | 0.480 | 0.000 | 0.480 |
| Waste | T eq | 133.680 | 0.000 | 133.68 |
| Radioactive waste | dm³ | 0.0066 | 0.000 | 0.0066 |
| WP | kg C02 | 0.190 | 17.497 | 17.687 |
| Acidification | kg S02 | 0.091 | 2744.41E-4 | 0.366 |
| Eutrophication | kg PO₄³⁻ | 0.011 | 2.232 | 2.243 |
| Ecotoxicity | m³ | 0.013 | 22401.8E-3 | 22.414 |
| Human toxicity | kg | 0.29 | 365.772E-3 | 0.656 |
| O3-smog | kg | 0.006 | 7E-3 | 0.013 |
| Odours | m³ | 0.490 | 0 | 0.490 |
• Scenario C
| Indicator | Unit | Construction | Exploitation/disposition | Total |
| Energy | MJ | 324.050 | 0.000 | 324.050 |
| Water | kg | 163.550 | 0.000 | 163.550 |
| Resources | 10ˉ⁰⁹ | 0.920 | 0.000 | 0.920 |
| Waste | T eq | 255.220 | 0.000 | 255.220 |
| Radioactive waste | dm³ | 0.013 | 0.000 | 0.013 |
| GWP | kg C02 | 47.470 | 54.32 | 101.790 |
| Acidification | kg S02 | 0.107 | 2744.41E-4 | 0.382 |
| Eutrophication | kg PO₄³⁻ | 0.013 | 2.02 | 2.033 |
| Ecotoxicity | m³ | 0.016 | 3227.95E-3 | 3.246 |
| Human toxicity | kg | 0.290 | 2946.62E-3 | 3.237 |
| O3-smog | kg | 0.0057 | 5.5E-3 | 0.012 |
| Odors | m³ | 0.621 | 0.000 | 0.621 |
• Scenario D
| Indicator | Unit | Construction | Exploitation/disposition | Total |
| Energy | MJ | 926.770 | 0.000 | 926.770 |
| Water | kg | 597.733 | 0.000 | 597.733 |
| Resources | 10ˉ⁰⁹ | 2.550 | 0.000 | 2.550 |
| Waste | T eq | 709.260 | 0.000 | 709.260 |
| Radioactive waste | dm³ | 0.035 | 0.000 | 0.035 |
| GWP | kg C02 | 148.360 | 268.237 | 174.597 |
| Acidification | kg S02 | 0.367 | 2744.0121E-4 | 0.643 |
| Eutrophication | kg PO₄³⁻ | 0.045 | 2.550 | 2.995 |
| Ecotoxicity | m³ | 0.051 | 3227.95E-3 | 3.279 |
| Humantoxicity | kg | 1.101 | 2946.62E-3 | 4.047 |
| O3-smog | kg | 0.021 | 2.116 | 2.137 |
| Odors | m³ | 2.051 | 0.000 | 2.051 |
4.2. Comparing Impact Factors
The diagram below enables us to visualize the impact coefficients of all the indicators for each scenario.
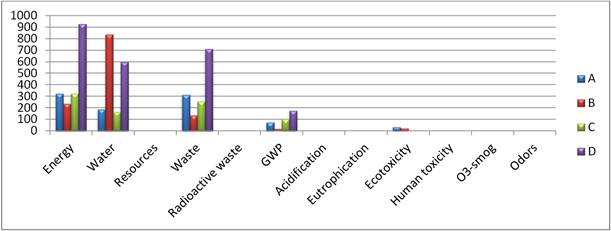
Figure 9. Total impact factors of the life cycle.
It can be noted that indicators of pollution with the highest values are: energy, water consumption, waste, GWP. For the first three indicators, pollution is mainly produced during the construction phase, except for scenario B whose use entails considerable water consumption. However GWP is at its maximum during the use of the system for scenarios B. C. D.
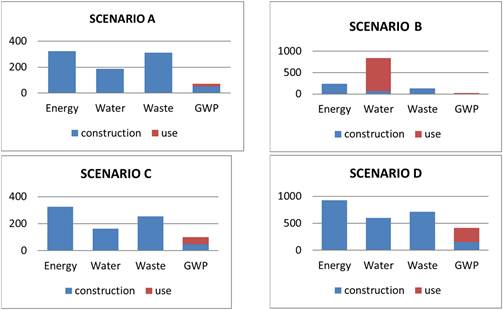
Figure 10. Distribution of the impact factors according to the stages of the life cycle for energy, water, waste and GWP indicators.
It is also noted that for these four indicators, the EcoSan latrine is the most polluting. This could be explained by the fact that the construction of the latrine entails the use of a greater quantity of materials. However, if we consider the valorization of sludge in agriculture, it should be normal to consider a reduction in the use of the artificial fertilizers and in pollution induced by artificial fertilizers. Some impact factors of artificial fertilizers (urea) are given in the following table [11]:
Table 19. Impact factors of artificial fertilizers according to the stages of the life cycle.
| Indicator | Energy | GWP | Acidification | eutrophication | Human toxicity |
| Unit | MJ | Kg CO2 | Kg SO2 | kg PO₄³⁻ | kg |
| Manufacture | 937.216 | 36.61 | 0.121 | - | - |
| use | 0 | 62.237 | 2.197 | 1.3403 | 0.09 |
| total | 937.216 | 98.847 | 2.318 | - | - |
For energy and GWP indicators, we obtain the following diagram:
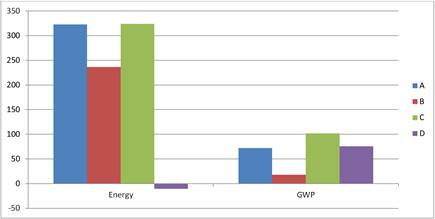
Figure 11. Results for indicators energy and GWP considering manures pollution impacts.
In this case, Scenario D achieves an environmental benefit for these indicators.
In the decreasing order of the indicators with high coefficients of impacts, we have human toxicity and ecotoxicity indicators.
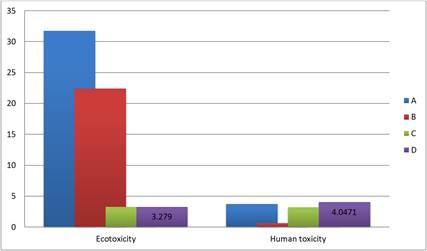
Figure 12. Factors of toxicity and ecotoxicity indicators of the life cycle.
It can be noted that scenarios A and B are the most dangerous for the ecosystems, while scenarios D and A are the most dangerous for humans. The contribution of life cycle phases of each indicator for the various scenarios is given in the diagrams below.
The phase of use is the one which presents the most toxic and eco-toxic risks. This is due to the load in heavy metals of excreta evacuated into nature. Heavy metals are all the more dangerous for the ecosystems, especially for aquatic ecosystems. This is why scenarios A and B are most representative of this pollution. In the same way, heavy metals evacuated into the ground can be found mainly in food resulting from agriculture and present a toxicity risk for humans.
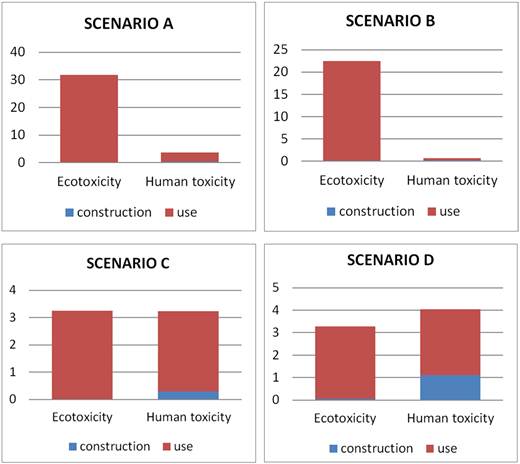
Figure 133. Distribution of impact factors according to the stages of the life cycle for the eco-toxicity and human toxicity indicators.
The other indicators are given in the diagram below:
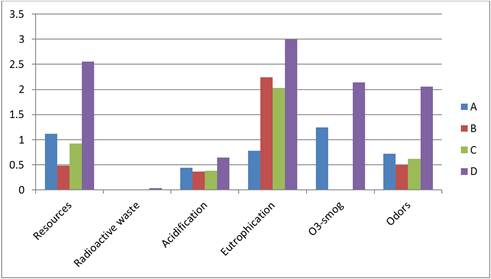
Figure 144. Resources, radioactive waste, acidification, eutrophication, smog and odor factors indicators for the entire life cycle.
It is noted that for all these indicators, scenario D is the most polluting. The contribution of life cycle stages for these indicators is the following:
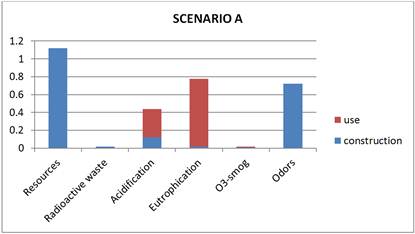
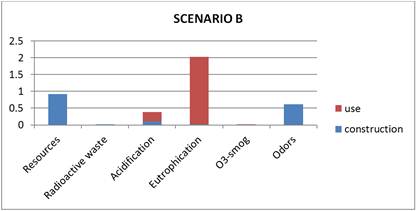
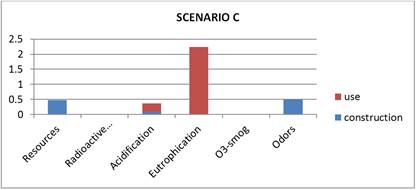
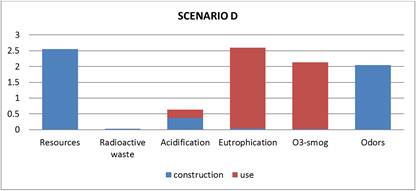
Figure 155. Distribution of the impact factors according to the stages of the life cycle for resources Radioactive waste, acidification, eutrophication, smog and odour indicators.
For all the scenarios, the resources, radioactive waste and odour indicators refer to the stage of construction. What ensues naturally is that scenario D, due to the fact that its cost of construction is higher than all the other scenarios, is regarded as more polluting for these indicators. However, the acidification, eutrophication and smog indicators are mainly related to the stage of the use of the system. These indicators are for the major part related to the nutritive elements contained in excreta (P. N). For this purpose, the scenario D, due to the re-use of excreta in agriculture, may appear as the most polluting. However, if one considers the impact of the life cycle of fertilizers, we obtain the following diagram:
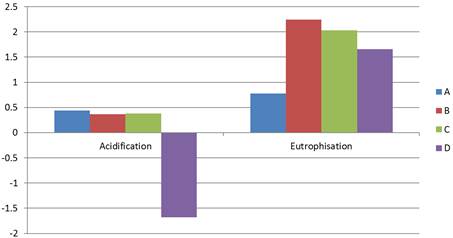
Figure 16. Acidification and eutrophication factors considering chemical fertilizers pollution.
Thus, for the acidification indicator, scenario D enables us to achieve substantial environmental benefits compared to the other scenarios.
5. Discussion
The most polluting device regarding the number of indicators for those impact factors are the highest, and without considering the impact of manures, is the EcoSan latrine (scenario D). But knowing that it is a life cycle study, we must consider the entire life cycle and include the manures impact for more …
Where this is taken in consideration, scenario D represents the less polluting (energy, GWP, acidification, eutrophication) and the Pit latrine is the most polluting (A&C). However, the most polluting device cannot be determined only by the value of factors, but also considering the weight of each indicator on the global pollution. For example, we can have a very high value for energy consumption and very low for eutrophication but the direct effect of eutrophication on humans, animals and plant are far more dangerous so that energy consumption is negligible. It is why normalization method has been elaborated. Each indicator has a score which is multiplied by the impact factor. A summation of all indicators is made and we obtain a number representing the impact. Numbers are easy to compare so using that method, a choice can easily be made. Another method is to convert potential impact into potential effects on human beings, animals, plants, and resources. But such methods must be adapted to the study context. If we could determine the main indicators on our context study, we must focus on the people practices. For example, considering that people in spontaneous neighborhood directly consume water from river, well, polluted by the sanitation devices, indicators such as eutrophication, toxicity and ecotoxicity must be particularly regarded; Or water consumption considering the lack of drinking water in the region.
6. Conclusion
Environmental impacts of the Independent sanitation systems vary according to the stages of the life cycle. Thus, the construction stage has impacts on energy, resources, water, waste and radioactive waste as well as odours. The maintenance and production stages generate impacts characterized by toxicity, eco-toxicity, acidification, GWP, eutrophication and smog. The EcoSan latrine is the most polluting system for the majority of indicators, except for the water and eco-toxicity indicators. However, considering the pollution induced by the chemical fertilizers. For the energy, acidification and eutrophication indicators, this system yields an environmental benefit. For the devices actually used by the population in the Bonamoussadi neighborhood, scenario A is the most pollutant.
Considering these results, we strongly urge public authorities to promote the use of the EcoSan latrines within neighborhoods with spontaneous housing, and to sensitize the populations on the impacts of the use of the traditional sanitation systems. In the same way it would be important to consider the valorizing fecal sludge in agricultural.
References
- MINEE (ministry of water and energy) Cameroon (August 2011). National strategy of liquid sanitation. Water partnership program (WPP) and World Bank Program.
- United States Program For Human Establishments 2007. Participative program of making urban profiles in African countries.Urban profile of Yaoundé.Printing: UNON.Publishing Services Section. Nairobi. ISO 14001:2004-certified 41p.
- BEMMO Nestor.National advanced school of engineering.Yaounde-Cameroun. Drinking water Food program in suburban neighborhood and small centers.Program Solidarity water. 121p.
- N.L. Shouw. S. Danteravanich. H. Mosbaech.J.C. Tjell.(2002) composition of human excreta- a case of study from southern Thailand.
- Babatunde Femi Bakare.Scientific and management support for ventilated improved pit latrine (VIP) sludge content.
- Miss FANNY (2007).Study of the possibilities of valorization of faecal sludge treatment products:case study of Yaoundé.Cameroun.Projet d’étude.ENESAD(Ecolenationale d’enseignement Supérieur d’agronomie de Dijon) studyprojectFrance.
- NGOUADJIO Alain Claude (2013) life cycle assessment of a social housing. National Advanced School of engineering, Yaounde Cameroun.98p.
- ELIME BOUBOAMA Aimé (2012).making of an indicator for life cycle assessment:application to energy consumption.doctorate thesis: National Advanced School of engineering, Yaounde Cameroun.
- TSIMI NGAH Inès (2015) contribution of life cycle assessment to the management of faecal sludge of a neighborhood with spontaneous housing.National Advanced School of engineering,Yaounde Cameroun.114p.
- Door MRJ.TowprayoonS..Manso-Vieira SM. Irving W. Palmer C.Pippatti R and Wang C. (2006).IPCC guidelines for national greenhouse gas inventories.Japan.
- GODIN David.(2012) environmental and economic life cycle assessment of a waster water treatment plant.
- Bruno Marien Et Jean-Pierre Beaud 2003. Environmental impact of three types of nitrogenized. University agency of french speaking countries.Québec.
- Ministry of environment and nature protection (2014). Environmental standards and inspection procedures for industrial and commercial installations in Cameroon.
- Mark GOEDKOOP, Reinout HEIJUNGS, Mark HUIJBREGTS An De SCHRYVER, JAAP STRUIJS, Rosalie Van ZELM (2013).A life cycle impact assessment method which comprises harmonized category indicators at the midpoint and the endpoint level.Ministry of Housing, Spatial Planning and Environment Netherlands.
- Bureau Of Indian Standards (2012), manakbhavan, 9 bahadur shah zafarmargnew delhi 110002 environmental management — life cycle assessment — principles and framework 26p.
- Miguel ANGEL, Lopez ZAVALA, Naoyuki FUNAMIZU and Tetsuo TAKAKUWA (2002), characrezation of feces for describing the aerobic biodegradation of feces. J. Environ. Syst and Eng. JSCE, No 720/ VII-25, 99-105.
- Doka, G., 2011- Life Cycle Inventories of Waste Treatment Services. Ecoinvent report No.13, Swiss Centrefor Life Cycle Inventories. Part IV, Was Cycle Inventory Database "ecoinvent 2000".
- Nemecek, T., Kägi T., Blaser S., 2007-Life Cycle Inventories od Agricultural Production Systems. Final report ecoinvent v2.0 No.15.Agroscope FAL Reckenholz and FAT Taenikon, Swiss Centre for LifeCycle Inventories, Dübendorf, CH.


