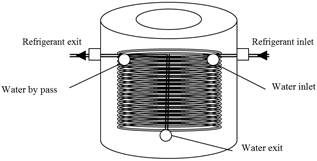
Figure 4. A schematic diagram of the shell and coil evaporator, Mahmood [16].
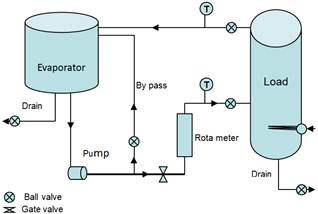
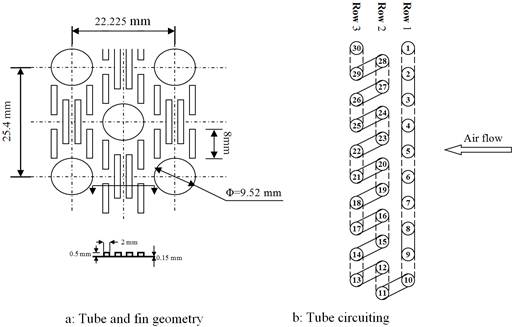
The condenser is manufactured in a way that the refrigerant flows in single tube circuit having three tube rows as shown in figure (3.b). A shell and coil evaporator was designed and fabricated in the local market workshops, figure 4. The refrigerant flows inside the copper helical coil, whereas the water is circulated on the shell side between the evaporator and external load reservoir.
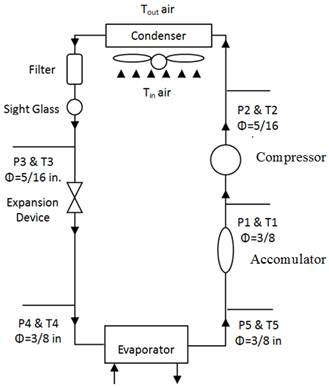
A reciprocating hermetic compressor charged with polyolester oil as a lubricant. This type of oil is suitable to be used with HCFC such as R-22 refrigerant and working with the test HFC refrigerant. The expansion device was made of (90) cm copper capillary tube of (1) mm internal diameter and external diameter of (2) mm. It was selected and installed as a part of the experimental test rig according to ASHRAE (1979) [17]. The evaporator shell, water pump and piping system were completely insulated with a sheet of Armaflex having a thickness of (25) mm and thermal conductivity of (k = 0.036) W/m.K. Full details for the experimental rig set-up and construction may be found in Mahmood[16].
Table 1. Condenser Physical Characteristics, Mahmood [16].
| Dimension specification | Value |
| Height of the condenser, H, (mm) | 279.4 |
| width of the condenser, L, (mm) | 254 |
| depth of the condenser, Ddep, (mm) | 65 |
| Tube length (mm) | 254 |
| Inner tube diameter (mm) | 7.93 |
| Outer tube diameter (mm) | 9.52 |
| Transverse tube pitch (mm) | 25.4 |
| Longitudinal tube pitch (mm) | 22.225 |
| Number of tube circuits | 1 |
| Number of tubes per circuits | 30 |
| Total number of tubes | 30 |
| Number of tube rows | 3 |
| Number of tubes per row | 10 |
| Tube metal | Copper |
| Tube metal thermal conductivity (W/m.K) | 386 |
| Inner tube surface | Smooth |
| Fin thickness (mm) | 0.15 |
| Fin pitch (mm) | 2 |
| Number of fin per inch (FPI) | 12 |
| Fin type | Louvered |
| Fin metal | Aluminum |
| Fin metal thermal conductivity (W/m.K) | 200 |
| Total surface area of the condenser (m2) | 4.074 |
| Total bare tube surface area (m2) | 0.228 |
| Total exposed fin area (m2) | 3.846 |
Four refrigerants, namely R-22, R-134a, R-407C and R-404a were implemented during the tests. These refrigerants were assessed in a drop-in technique to find out the best alternative to the R-22 refrigerant circulated in a water chiller. It is worth mentioning that Mahmood [16] stated that the experimental data collected for the condenser has an uncertainty for the measured performance parameters to fall within (± 2%).
3. Model Methodology
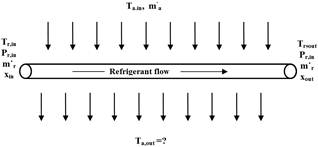
Figure 5. A control volume of an individual tube.
The condenser model is based on a tube-by-tube approach in backward scheme in view of vapor flow and cooling air flow directions. Evaluation of performance for a single fined tube is a basic part of the model, as in figure 5. The performance of each tube is analyzed separately at a certain time. Each tube is associated with refrigerant parameters, specific air mass flow rate and inlet air temperature. In the backward scheme, the selection of tubes for performance evaluation is in the opposite of the refrigerant flow from the outlet to the inlet.
Air mass flow rate was assumed to be uniformly distributed over the whole coil face regardless of the coil and fan respective locations. It was also assumed that there was enough turbulence in the air stream passing through the coil to provide effective mixing so that air of uniform properties enters each tube bank. The idea of implementation of the step by step technique with a detailed description in Tarrad [9], Tarrad et al. [13] was considered in the present work for the condenser rating methodology.
3.1. Refrigerant Side Heat Transfer Coefficient
3.1.1. Single Phase
The Dittus-Boelter correlation was used to calculate the single phase heat transfer coefficient for the turbulent flow, Incropera and Dewitt (1996) [18]. For the single liquid phase refrigerant, the heat transfer coefficient is expressed as:
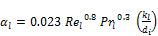 (1)
(1)
Where liquid Reynolds number and Prandtl number are estimated as:
 (2)
(2)
 (3)
(3)
This mathematical relation has been confirmed by experimental data for the following conditions:
(0.7 £ Pr £ 160), (Re ³ 10,000) and (L/di ³ 10)
In the sub-cooled portion of the condenser in this study, the temperature difference at the inlet and exit is usually less than (10)°C, and the moderate temperature variation assumption is valid. However, in the superheated portion of the condenser, the inlet and exit temperatures can differ by as much as (50)°C. Therefore, the more accurate Kays and London (1984) [19] correlation was used in the present model to predicted the heat transfer coefficient of the superheated portion. The correlation is expressed as:
 (4)
(4)
Where the coefficients ast and bst are as follows:
Laminar
Re < 3,500 ast = 1.10647, bst = -0.78992
Transition
3,500 £ Re £ 6,000 ast = 3.5194 x 10⁻⁷, bst = 1.038040
Turbulent
6,000 < Re ast = 0.2243, bst = -0.38500
The Stanton number, St is expressed as:
 (5)
(5)
The superheated vapor Reynolds and Prandtl numbers are estimated as the following:
 (6)
(6)
 (7)
(7)
The thermal properties of the superheated vapor of refrigerant are correlated in suitable curve fitting equations.
3.1.2. Two Phase
Shah (1979) [20] developed a heat transfer model for pure fluids condensation. The condensation operating conditions were the mass flux range to be within (11 < G < 211) kg/m2.s and the reduced pressure of (0.002 < Pr < 0.44). He also stated that the model should be restricted to (1< Prl < 13) and (Rel > 350) due to limited data at lower Rel values. This correlation was found to predict all the data considered with a mean deviation of (17%), [20]:
 (8)
(8)
Where αl represent the liquid heat transfer coefficient determined from Dittus-Boelter equation (1) and (Pr) represent the reduce pressure. The Silver-Bell-Ghaly method, Silver (1947) [21], Bell and Ghaly (1973) [22], is used to predict condensation heat transfer coefficient of miscible mixture, where all component are condensable. The effective condensing heat transfer coefficient (αeff) for condensation of mixture is calculated by the method as:
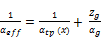 (9)
(9)
Where αtp (x) the condensation heat transfer coefficient is obtained from Shah (1979) [20] correlation for pure fluid, equation (8). The single phase heat transfer coefficient of the vapor αg is calculated with the Dittus-Boelter turbulent flow correlation using the vapor fraction of the flow in calculating the vapor Reynolds number.
 (10)
(10)
The parameter Zg is the ratio of the sensible cooling of the vapor to the total cooling rate:
 (11)
(11)
Here (x) is the local vapor quality, (cpg) is the specific heat of the vapor and ∆Tdew/dh is the slope of the dew point temperature curve with respect to the enthalpy of the mixture as it condenses. The total enthalpy change is that of the latent heat plus sensible heat. The latter can be estimated as the mean of the liquid and vapor specific heat applied to the condenser temperature glide Thome (2007) [23].
 (12)
(12)
This method has been applied to hydrocarbon mixtures and more recently to binary and ternary zeotropic refrigerant blend by Cavallini et al. (1995) [24] and binary refrigerant mixtures by Smit et al. (2001) [25].
3.2. Air Side Heat Transfer Coefficient
3.2.1. Flat Fins
The correlation of Gray and Webb (1986) [26] was selected to calculate the air side heat transfer coefficient for flat fins. The correlation provides an average value for the j-factor for a heat exchanger with four or more tube depth rows, no change in the j-factor after four rows is assumed. The heat transfer coefficient is based on the Colburn j-factor which is defined as:
 (13)
(13)
This relationship gives the following for the air convective heat transfer coefficient, αa.
 (14)
(14)
Where Gmax is the air mass flux through minimum flow area calculated as:
 (15)
(15)
In the case of the present study, the minimum flow area is estimated as:
 (16)
(16)
And the collar diameter (Dc) is calculated as:
 (17)
(17)
The j-factor for four rows is calculated as:
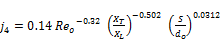 (18)
(18)
The Reynolds number based on the outside tube diameter can be estimated by:
 (19)
(19)
To calculate an average value for the j-factor for heat exchangers with less than four depth rows, jN (where N<4), Gray and Webb (1986) [26] provided the following equation:
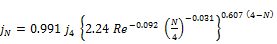 (20)
(20)
Here j4 is obtained by equation (18). Tube-by-tube simulation requires the availability of the air-side heat transfer coefficient for a tube in a given row, Tarrad and Altameemi (2015) [15]. Assuming that each row weights equally on the average air-side heat transfer coefficient of the coil, the heat transfer coefficient value for the depth row (N), jN,R can be approximated by the formula, Domanski (1989) [3]:
 (21)
(21)
Where
jN, jN-1 = average j-factors for heat exchangers with (N) and (N-1) depth rows, respectively, obtained by equation (20).
3.2.2. Lanced Fins (Louvered)
Lanced fins are those enhanced fins which have arrays of small strips raised from the base plate. Nakayama and Xu (1983) [27] proposed a heat transfer correlation for such fins. Their formula is in the form of a heat transfer correlation for a flat fin and a multiplier which provides correction for heat transfer enhancement due to the raised strips. The lanced fin enhancement multiplier is a function of the geometry parameters shown in figure 6.
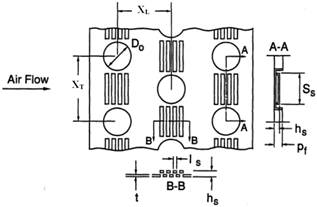
Figure 6. Geometry of the lanced (louverd) fin, Mahmood [16].
The proposed correlation has the following form:
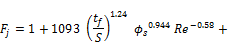
 (22)
(22)
Where
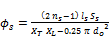 (23.a)
The Reynolds number based on the hydraulic diameter expressed as:
 (23.b)
And the hydraulic diameter estimated as Kays and London (1974) [28]:
 (23.c)
 (23.d)
 (23.e)
 (23.f)
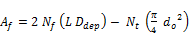
Where (Ao) is the total air side heat transfer area, fins and tubes, (Af) is the fin side heat transfer area and (At) is the tube side heat transfer area.
3.3. Fins and Surface Efficiency
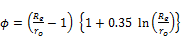
In the present study the fins of condenser is continuous, rectangular plates serving all tubes in the slab. The method proposed by Schmidt (1945) [29], and described in McQuiston (1994) [30], is sensitive to the pattern of tube staggering and is employed here. The fin efficiency, ηf, is calculated in terms of the fin root radius, ro and two parameters, mes and f:
 (24)
(24)
For a plate fin heat exchanger with multiple rows of staggered tubes, the plates can be evenly divided into hexagonal shaped fins as shown in Figure 7.
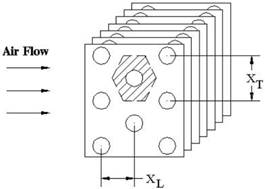
Figure 7. Staggered tube configurations.
Schmidt (1945) [29] analyzed hexagonal fins and determined that they could be treated like circular fins by replacing the outer radius of the fin with an equivalent radius. The empirical relation for the equivalent radius is given by:
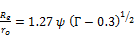 (25)
(25)
The coefficients Ψ and Г are defined as:
 (26.a)
 (26.b)
Once the equivalent radius has been determined, the equations for standard circular fins can be used. For this study, the length of the fins is much greater than the fin thickness. Therefore, the standard extended surface parameter, mes can be expressed as:
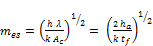 (26.c)
 (26.d)
The total surface efficiency of the fin, ηs is therefore expressed as:
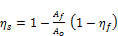 (27)
(27)
For louvered fins, Perrotin and Clodic (2003) [31] concluded that Schmidt’s circular fin approximation analysis overestimates the fin efficiency, by up to (5%). This is because the addition of the enhancement can alter the conduction path through the fin. However, there is currently no approximation method available in the open literature that claims to be valid for enhanced fins.
3.4. NTU Effectiveness Relations
The effectiveness is the ratio of the actual amount of heat transferred to the maximum possible amount of heat transferred and expressed mathematically as:
 (28)
(28)
The equations used to determine the effectiveness depend on the temperature distribution within each fluid and on the paths of the fluids as heat transfer takes place, i.e. parallel-flow, counter-flow or cross-flow. For a cross-flow heat exchanger with both fluids unmixed, the effectiveness can be related to the number of transfer units (NTU) with the following equation, Incropera and Dewitt (1996) [18]:
 (29.a)
 (29.b)
 (29.c)
In the saturated portion of the condenser, the heat capacity on the refrigerant side approaches infinity and the heat capacity ratio goes to zero. When Cr=0, the effectiveness for any heat exchanger configuration is:
 (29.d)
The NTU is a function of the overall heat transfer coefficient.
 (30)
(30)
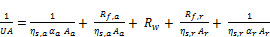 (31)
(31)
Where Rf,a and Rf,r is the fouling factor for the air and refrigerant sides respectively, Rw is the wall thermal resistance, ηs,a and ηs,r is the surface efficiency for the air and refrigerant sides respectively. There are no fins on the refrigerant side of the condensing tubes; therefore, the refrigerant side surface efficiency is (1). Neglecting fouling factors, Rf,a and Rf,r then:
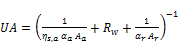 (32)
(32)
4. Model Results
4.1. Model Validation
The present model was verified by the implementation of the experimental data collected for four refrigerants tested with a water chiller. These were namely, the pure refrigerants R-22 and R-134a and the zeotropic miscible refrigerant mixtures R-407C and R-404A in the mode of steady state drop-in technique. The model calculation scheme depends on the prediction of the air exit dry bulb temperature that is leaving the condenser on the lee side. Hence, this parameter was considered as an indication for the uncertainty percentage of the simulation process of the present model. The uncertainty of each parameter and its discrepancy or scatter from the experimental data was estimated from:
 (33)
(33)
Here  represents either the exit air temperature or the heat duty of the condenser.
Figures 8 showed a comparison for the experimental and predicated condenser load for R-22, R-134a, R-407C and R-404A respectively. The maximum discrepancy percentage between experimental and predicted condenser load of R-22 was about (8%), while the predicted condenser load values of R-134a were within (±8%). The corresponding predicted condenser load values of R-407C were overestimated by (8%). Therefore, the scatter of the predicted condenser load for these refrigerants was within (±8%).
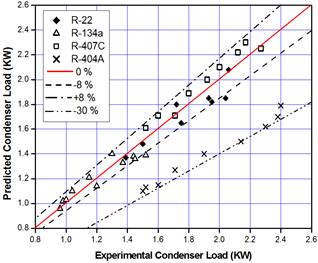
Figure 8. Comparison of the experimental and predicted condenser load.
R-404A showed the highest discrepancy, the condenser load of R-404A was under predicted as much as (30%). This could be attributed to the scatter of the predicted condensation heat transfer coefficient of R-404A. This concludes that the correlation used for this purpose was not suitable or not accurate enough.
Figure 9 demonstrates the comparison for the measured and predicated condenser air exit temperature (CAET) for R-22, R-134a, R-407C and R-404A respectively. It is obvious that the simulated results of the condenser air exit temperature (CAET) were well predicted than that of the condenser loads. The discrepancy percentage between measured and predicted condenser air exit temperature (CAET) of R-22 was about (-8%), whereas, the discrepancy percentage of R-134a were within (±4%). The predicted (CAET) of R-407C was around (4%) over predicted. R-404A revealed the maximums discrepancy, it was under predicted by about (15%).
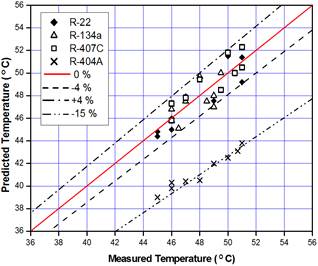
Figure 9. Comparison of the measured and predicted condenser air exit temperatures.
4.2. Visual Representation
4.2.1. Exit Air Temperature
The visual representation is considered more tangible for the analysis presentation as presented by Domanski (1989) [3] and Tarrad and Al-Nadawi (2015) [32]. In these figures the assigned tubes with grey and red are the inlet and exit ports of the refrigerant side respectively. Figures 10 showed the (CAET) distributions over the condenser coil tubes for the test refrigerants. The condenser layout, tube and rows are well demonstrated by the schematic diagram shown in the figure. The exit mean air temperature that is leaving the condenser is also shown at the lee side of the condenser. The data shows that as the air passes from row to row experiences an increase in the predicted air temperature. It is obvious that the simulated air tempera ture showed an excellent agreement with the measured values to be within (±4)% for the R-22, R-134a and R-407C. Whereas, the model showed a higher scatter for the R-404A data, it underestimates the measured exit air temperature by (15)%.
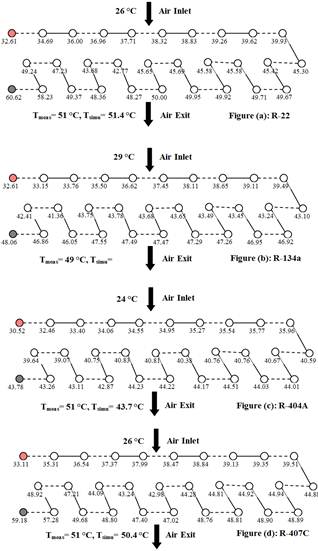
Figure 10. Condenser coil tube by tube air exit temperature distribution.
4.2.2. Heat Duty
A typical tube by tube heat duty distribution is shown in figure 11 for the entire test refrigerants at different operating conditions. It is obvious that lowest load is exhibited by the tubes accommodated in row number (3), the row where the superheated vapor enters the condenser and the cooling air leaves. Here, the temperature difference between both streams is low and the refrigerant heat transfer coefficient is the lowest. Accordingly, the heat absorbed by air at this row revealed the lowest rate among the other rows.
Figure 12 demonstrated the total condenser coil load variation with the tube number for R-22, R-134a, R-404A and R-407C. The simulated refrigerants reveal the same trend, the condenser load increased gradually in almost linear relation. However, the condenser coil load of the first row exhibited a higher numerical value than that of the second and third rows. The condenser load of the simulated refrigerant were, (2091 W), (1388 W), (2234 W) and (1768 W) for R-22, R-134a, R-407C and R-404A respectively. It is worth to mention here that the water chiller when circulating R-134a throughout the unit exhibited the lowest refrigeration load as stated by Tarrad et al. (2015) [33]. Accordingly, it reveals the lowest condenser load in agreement with the energy conservation law in the refrigeration cycle.
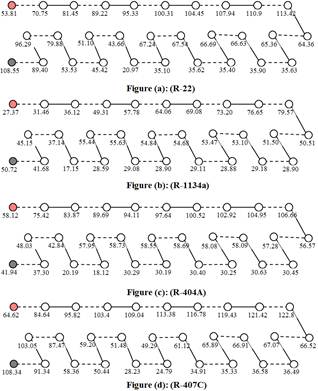
Figure 11. Condenser coil tube by tube load distribution.
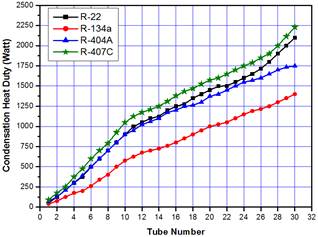
Figure 12. Total condenser coil load variation with the number of tubes.
The entire group of curves showed almost the same behavior but with different numerical values. The upper band included the R-22, R-407C and R-404A with a close predicted values and the R-134a revealed the lowest value of the heat duty. Again here, R-407C showed a close performance to that of the R-22 case due to the close values of the refrigeration load of the chiller as shown by Tarrad et al. (2015) [33].
4.2.3. Vapor Quality
The refrigerant vapor quality distribution (x) was demonstrated in figure 13 for the test refrigerants. The vapor quality variation showed a nonlinear behavior and R-134a has a longest path for the sub-cooling stage of the refrigerant through the condenser.
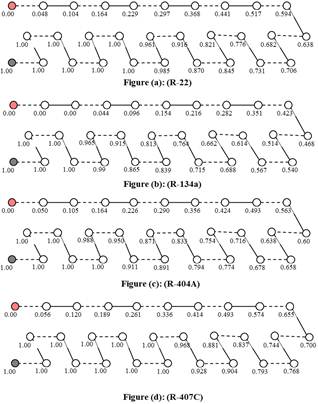
Figure 13. Refrigerant vapor quality (x) distribution.
5. Conclusions
The main findings of the present work are:
1. A simple and detailed air cooled condenser model has been developed for pure and mixture refrigerants R-22, R-134a, R-407C and R-404A.
2. The present model provided detailed information for the condenser design and performance characteristic. It offers a practical tool for the rating process of an existing water chiller for refrigerant alternatives.
3. The model showed excellent agreement for the load capacity and exit air temperature for the simulation of R-22, R-134a and R-407C to be within (±8)% and (±4)% respectively. The model underestimated the heat load and exit air temperature for R-404A by (30)% and (15)% respectively.
4. The model revealed its ability to predict the same trend of the condenser heat duty in a similar fashion as that of the refrigeration load of the water chiller measured during the experiments.
Nomenclature
| Symbol | Description | Units |
| A | Area | m2 |
| Ac | Cross sectional area | m2 |
| Af | Fin area | m2 |
| Amin | Minimum flow area | m2 |
| Ao | Total heat transfer area on the air side | m2 |
| At | Surface area of the tubes | m2 |
| ast | Kays & London coefficient | --- |
| bst | Kays & London power coefficient | --- |
| C | Heat capacity | W/K |
| cp | Specific heat at constant pressure | kJ/kg.K |
| Cr | Heat capacity ratio | --- |
| Dc | Collar diameter | m |
| Ddep | Depth of heat exchanger | m |
| DH | Hydraulic diameter | m |
| D | Diameter | m |
| Fj | Lanced fin enhancement multiplier | --- |
| G | Mass flux | kg/m2.s |
| g | Gravitational acceleration | m/s2 |
| hfg | Latent heat | J/kg |
| j | Colburn j-factor | --- |
| j4 | j-factor for four rows | --- |
| k | Thermal conductivity | W/m.°C |
| L | Length of tube | m |
| ls | Width of a stripe | m |
| m˙ | Mass flow rate | kg/s |
| mes | Extended surface parameter | --- |
| N | Number of rows | --- |
| Nf | Number of fins | --- |
| Nt | Number of tubes | --- |
| Nu | Nusselt number | --- |
| ns | Number of strips | --- |
| P | Pressure | Pa |
| Pr | Reduced pressure | --- |
| Pr | Prandtle number | --- |
| Q | Heat transfer | W |
| Re | Reynolds number | --- |
| Re | Fin equivalent radius | m |
| Rf | Fouling factor | m2.°C/W |
| Rw | Tube resistance | m2.°C/W |
| ro | Outside tube radius | m |
| St | Stanton number | --- |
| S | Fin spacing | m |
| ss | Length of a strip | m |
| T | Temperature | °C |
| Tdew | Dew point temperature | °C |
| tf | Fin thickness | m |
| U | Over all heat transfer coefficient | W/m2.°C |
| V | Velocity | m/s |
| XL | Longitudinal tube spacing | m |
| XT | Transverse tube spacing | m |
| X | Vapor quality | --- |
| Zg | Ratio of the sensible cooling of the vapor to the total cooling rate | --- |
Greek Symbols:
| α | Heat transfer coefficient | W/m2.°C |
| αeff | Effective heat transfer coefficient | W/m2.°C |
| ε | Effectiveness | --- |
| ζ | Tube per row | --- |
| η | Efficiency | --- |
| ηf | Fin efficiency | --- |
| ηs | Surface efficiency | --- |
| λ | Parameters | m |
| µ | Viscosity | Pa.s |
| ρ | Density | kg/m3 |
| τ | Life time | year |
| φ | Fin efficiency parameter | --- |
Subscripts:
| a | Air |
| act | Actual |
| g | Vapor |
| in | Inlet |
| l | Liquid |
| max | Maximum |
| meas | Measured value |
| min | Minimum |
| out | Outlet |
| r | Refrigerant |
| simu | Simulated value |
| tp | Two phase |
References
- Fischer, S. K. and Rice, C. K., "A Steady-State Computer Design Model for Air-to-Air Heat Pumps", Oak Ridge National Laboratory, ORNL/CON-8-, Oak Ridge, TN, (1981).
- Domanski, P. and Didion, D., "Computer Modeling of the Vapor Compression Cycle with Constant Flow Area Expansion Device", NBS Building Science Series 155, Washington, DC, May (1983).
- Domanski, P. A., "EVSIM – an Evaporator Simulation Model Accounting for Refrigerant and One Dimensional Air Distribution", NISTIR 89-4133, U.S. Dept. of Commerce, NIST, Maryland 20899, (1989).
- Zietlow, D. C., Ragazzi, F., and Pedersen, C. O., "A Physically Based Computer Model for Mobile Air Conditioning Condensers Using Ozone-Safe Refrigerants", University of Illinois at Urbana-Champaign, ACRC TR-17, April (1992).
- Bensafi, A. and Borg S.,"Design and Simulation of Finned-Tube Heat Exchangers Using Pure and Mixed Refrigerants", Proceedings of CLIMA 2000 Conference, August 30th to September 2nd, 1997, Belgium, Brussels, (1997).
- Mullen, C. E., Bridges, B. D., Porter, K. J., Hahn, G. W., Bullard, C. W., "Development and Validation of a Room Air Conditioning Simulation Model", ASHRAE Transactions, Vol. 102, Part 2, (1998).
- Sadler, E. M., "Design Analysis of a Finned-Tube Condenser for a Residential Air-Conditioner using R22", M.Sc. Thesis, Georgia Institute of Technology, (2000).
- Wright, M. F., "Plate-Fin-and-Tube Condenser Performance and Design for Refrigerant R-410a Air-Conditioner.", M.Sc. Thesis, Georgia Institute of Technology, (2000).
- Tarrad, A. H., "A Numerical Model for Performance Prediction of Dry Cooling Conditions of Air Cooled Condensers in Thermal Power Plant Stations", Engineering and Technology Journal, Vol. 28, No. 16, pp. 5271-5292, 2010.
- Altameemi, A. F., "Study and Evaluation of the Operation Characteristics for the Condensation Load Distribution in Hybrid Systems on the Condenser Side", MSc. Thesis, Al-Mustansiriya University, Baghdad, June 2011.
- Tarrad A. H., Shehhab U. S.,"The Prediction of Environment Effect on the Performance of a Vapour Compression Refrigeration System in Air Conditioning Application", Journal of Engineering and Development. Vol. 11, No. 1, March 2007, pp.169-189.
- Tarrad, A. H., Khudor, D. S., and Abdul Wahed, M.,"A Simplified Model for the Prediction of the Thermal Performance for Cross Flow Air Cooled Heat Exchangers with a New Air Side Thermal Correlation", Journal of Engineering and Development, Vol. 12, No. 3, 2008.
- Tarrad, A. H., Saleh, F. A., and Abdulrasool, A. A., "A Simplified Numerical Model for a Flat Continuous Triangle Fins Air Cooled Heat Exchanger Using a Step by Step Technique", Engineering and Development Journal, Vol. 13, No. 3, pp. 38-59, Al-Mustansiriya University, Baghdad, (2009).
- Tarrad, A. H. and Khudor, D. S., "A Correlation for the Air Side Heat Transfer Coefficient Assessment in Continuous Flat Plate Finned Heat Exchangers", Transactions of the ASME, Journal of Thermal Science and Application, Vol. (7), No. 2, Paper No. TSEA-14-1194, DOI: 10.11151/1.4029459, 2015.
- Tarrad, A. H. and Altameemi, A. F., "Experimental and Numerical Model for Thermal Design of Air Cooled Condenser", Global Journal of Researches in Engineering (GJRE-A), Mechanical and Mechanics Engineering, Volume 15, Issue 3, Version 1.0, pp. 11-26, 2015.
- Mahmood, D. M., "Experimental and Theoretical Evaluation for the Evolution in Alternatives Applications in Water Chillers", MSc. Thesis, Mechanical Engineering Department, College of Engineering, Al-Mustansiriya University, Baghdad, Iraq, (2010).
- ASHRAE Handbook, "HVAC systems & Equipment", American Society of Heating, Refrigeration, and Air Conditioning Engineers, Inc., New York, (1979).
- Incropera, F. P. and DeWitt, D. P., "Fundamentals of Heat and Mass Transfer", Fourth Edition, John Wiley & Sons, New York, (1996).
- Kays, W. M. and London, A. L., "Compact Heat Exchangers", Third Edition, McGraw-Hill, New York, (1984).
- Shah, M. M., "A General Correlation For Heat Transfer During Film Condensation Inside of Pipes", Int. J. Heat and Mass Transfer, vol. 22, pp. 547-556, (1979).
- Silver, L., "Gas Cooling with Aqueous Condensation", Trans. Inst. Chem. Eng., Vol. 25, pp. 30-42, (1947).
- Bell, K. J., Ghaly, M. A., "An approximate generalized design method for multi-component partial condensers", AICHE Symposium Series, Vol. 69, pp. 72-79, (1973).
- Thome, J. R., "Engineering Data Book III", Wolverine Tube Inc., (2008).
- Cavallini, A., Bella, B., Longo, G. A. and Rossetto, L., "Experimental Heat Transfer Coefficients during Condensation of Halogenated Refrigerants on Enhanced Tubes", J. Enhanced Heat Transfer, Vol. 2, No. 1-2, pp. 115-125, (1995).
- Smit, F. J., Tome, J. R. and Meyer, J., "Heat Transfer Coefficients during Condensation of the Zeotropic Refrigerant Mixture R-22/R-142b", J. Heat Transfer, Vol. 124, pp. 1137-1146, (2001).
- Gray, D. L. and Webb, R.L., "Heat Transfer and Friction Correlations for Plate Finned-Tube Heat Exchangers Having Plain Fins", Proc. Of Eighth Int. Heat Transfer Conference, San Francisco, (1986).
- Nakayama, W. and Xu, L. P., "Enhanced Fins for Air-Cooled Heat Exchangers Heat Transfer and Friction Factor Correlations", Proceedings of ASME JSME Thermal Engineering Joint Conference, p. 495, March 1983, ASME, New York, (1983).
- Kays, W. M. and London, A. L., "Compact Heat Exchangers", 2nd Edition, McGraw-Hill, New York, (1964).
- Schmidt, T. E., "La Production Calorifique des Surfaces Munies d’ailettes", Annexe Du bulletin De L’Institut International Du Froid, Annexe G-5, (1945).
- McQuiston, F. C. and Parker, J. P., "Heating, Ventilating and Air-Conditioning Analysis and Design", John Wiley & Sons, (1994).
- Perrotin, T. and Clodic, D., "Fin Efficiency Calculation in Enhanced Fin-and-Tube Heat Exchangers in Dry Conditions", Proceedings of the 21st International Congress of Refrigeration, Paper # ICR0026, August (2003).
- Tarrad, A. H. and Al-Nadawi, A. K., "A Rating Model for Air Cooled Condensers using Pure and Blend Refrigerants", American Association for Science and Technology (AASCIT), American Journal for Science and Technology, 3(1), 1-11, 2016.
- Tarrad, A. H., Saleh, F. A., and Mahmood, D. M., "A Thermal Assessment for Vertical Helical Immersion Coil Evaporator in a Water Chiller", American Association for Science and Technology (AASCIT),American Journal of Energy and Power Engineering, 2 (5), pp. 62-73, September, 2015.
 (A. H. Tarrad)
  (A. F. Altameemi)
  (D. M. Mahmood)