Gene Expression Microarray Data from Late Endothelial Progenitor Cells
Dan Zhang, Longqiu Cheng
Department of Biotechnology, Jinan University, Guangzhou, China
Email address

(Longqiu Cheng)
Citation
Dan Zhang, Longqiu Cheng. Gene Expression Microarray Data from Late Endothelial Progenitor Cells. AASCIT Journal of Bioscience. Vol. 2, No. 4, 2016, pp. 34-41.
Abstract
Numerous in vitro and in vivo studies imply that the late EPCs released from bone marrow can participate in endothelial repair and angiogenesis. However, the molecular basis or signals causing their migration and homing to sites of mature vascular endothelium or extravascular tissue are largely unclear at present. To investigate the molecular basis, we studied the gene expression profile in late EPCs. We used Transcriptomic microarray analysis to detect the expression of genes in three EPCs and three HUVEC samples, and differentially expressed genes were identified through Volcano Plot filtering. The function of differentially expressed genes was determined by pathway and Gene ontology (GO) analyses. A total of 2941 genes were found to be differentially expressed between late EPCs and HUVEC groups. HUVEC as control, the late EPCs exhibited different gene expression profile, GO and pathway analyses showed that the functions of differentially expressed genes were closely related with many processes which involved in the development of angiogenesis.
Keywords
Late Endothelial Progenitor Cells (Late EPCs), Human Transcriptome Array 2.0 (HTA 2.0), Differentially Expressed Genes, Up-Regulated Genes, Down-Regulated Genes
1. Introduction
Endothelial progenitor cells (EPCs) are located at the periphery of the blood islands in the embryonic yolk sac and saved in the bone marrow after birth, they can circulate from bone marrow to incorporate into endothelium injury sites and thus contribute to postnatal physiological and pathological angiogenesis [1, 2]. However, angiogenesis is a very complex process which involves multiple cell types, growth factors, cytokines, adhesion molecules, and signal transduction [3]. The angiogenesis process depends on angiogenic stimulation firstly, after that, activated endothelial cells (ECs) secretes various proangiogenic and proinflammatory molecules. Then, increased permeability, vasodilatation, and extravasation of leucocytes occur. Basal membrane and extracellular matrix (ECM) are degraded by metalloproteinases and proteases. ECs proliferate and migrate from this degraded area [4, 5].
Late EPCs and HUVEC, as different endothelial cells, both play an important role in the process of angiogenesis. Especially clinical studies using EPCs for angiogenesis had been started [6-8]. To determine the molecular basis of late EPCs which mobilized from bone marrow incorporating into endothelium injury sites and contributing to postnatal vasculogenesis, we used Human Transcriptome Array 2.0 to detect the differentially expressed genes associated with angiogenesis between late EPCs and HUVEC in this study [9].
2. Materials and Methods
2.1. Endothelial Progenitor Cell and HUVEC Culture
Primary late EPCs isolated from human umbilical cord blood and cultured in EGM-2MV (Lonza) supplemented with 10% FBS [10-12]; HUVEC isolated from human umbilical cord and cultured in DMEM/F12 (Lonza) supplemented with 10% FBS. And a total of six samples (three late EPCs, three HUVEC samples) were generated for subsequent gene expression analyses.
2.2. RNA Isolation and Quality Control
Cell monolayers were harvested using trypsin and lysed with TRIzol® Reagent (Invitrogen). Total RNA was isolated and purified using an RNeasy Mini Kit (Qiagen) according to manufacturer protocol, and eluted with nuclease-free water. The NanoDrop ND-1000 was used to measure RNA quantity, and RNA quality was tested using an NanoDrop® UV-Vis Spectrophotometer, RNA integrity was assessed by standard denaturing agarose gel electrophoresis.
2.3. Probe Preparation and Gene Chip Hybridization
All subsequent sample handling, labeling, and GeneChip (Human Transcriptome Array 2.0, HTA 2.0) processing was performed at the Shanghai Gene company limited. Single stranded complimentary DNA was prepared from 500ng of total RNA as per the Ambion WT Expression Kit for Affymetrix GeneChip Whole Transcript WT Expression Arrays. Total RNA was first converted to cDNA, followed by in vitro transcription to make cRNA. Single stranded cDNA was synthesized, end labeled and hybridized, for 16 h at 45℃ and 60RPM (GeneChip® Hybridization Oven 645), to Human Transcriptome Array 2.0 (Affymetrix). All liquid handling steps were performed by a GeneChip® Fluidics Station 450 and GeneChips were scanned with the GeneChip® Scanner 3000 7G (Affymetrix) using Command Console v3.2.4.
2.4. Statistical Analyses of Changes in Full Gene Expression
The fluorescence signals of the microarray were scanned and saved as DAT image files. The AGCC software (Affymetrix Gene Chip Command Console) transformed DAT files into CEL files to change image signals into digital signals, which recorded the fluorescence density of probes. Next, we used Gene Expression Console software (Affymetrix) to pretreat CEL files through Robust Multichip Analysis (RMA) algorithm, including background correction, probeset signal integration, and quantile normalization. After pretreatment, the obtained chp files were analyzed by Transcriptome Analysis Console 3.0 (TAC) software (Affymetrix) to detect differentially expressed genes (DEGs). And a filtered gene list was generated with p value (p<0.05) and fold change >+2 or <−2. Pathway and gene ontology (GO) analyses were applied to determine the functional roles of differentially expressed genes.
2.5. GO and Pathway Analyses for Differentially Expressed Genes
Gene ontology (GO) analysis allowed functional association of differentially expressed genes using three structured networks of defined terms that describe gene-product attributes. The p-value denotes the significance of GO-term enrichment in the differentially expressed genes list. The p-value cut-off was set at 0.05.
Differentially expressed genes screened by Volcano Plot filtering were further investigated to determine the pathways using the latest Kyoto Encyclopedia of Genes and Genomes (KEGG) database. The p-value denotes the significance of the pathway-term enrichment, and the p-value cut-off was set at 0.05.
2.6. Quantitative Real-Time PCR
Real-time PCR was used to verify microarray results. Total RNA was extracted from three EPCs samples and three HUVEC samples. Primers were designed using the Primer Premier 6.0 software. Total RNA was converted to cDNA by using the Takara kits (Japan) according to the manufacturer’s instructions.
3. Result and Discussion
3.1. The Quality Control Report of Total RNA Samples
Total RNA quality was assessed by OD 260/280 values (≈2) and agarose gel electrophoresis (28S: 18S = 2:1), and the quality of each sample for Human Transcriptome Array 2.0 was Qualified (Table1).
Table 1. The quality control report of the total RNA samples.
| Sample | Concentration (ng/μl) | OD260/OD280 | Total (µg) | Electrophoresis | Comprehensive evaluation |
| HUVEC-1 | 483.1 | 2.02 | 14.5 | Qualified | Qualified |
| HUVEC-2 | 583.7 | 2.03 | 17.5 | Qualified | Qualified |
| HUVEC-3 | 1361.5 | 2.09 | 40.8 | Qualified | Qualified |
| EPCs-1 | 186.3 | 2.05 | 5.5 | Qualified | Qualified |
| EPCs-2 | 237.2 | 2.06 | 7.1 | Qualified | Qualified |
| EPCs-3 | 248.6 | 2.07 | 7.4 | Qualified | Qualified |
3.2. Quality Control Profile of Samples and Microarray
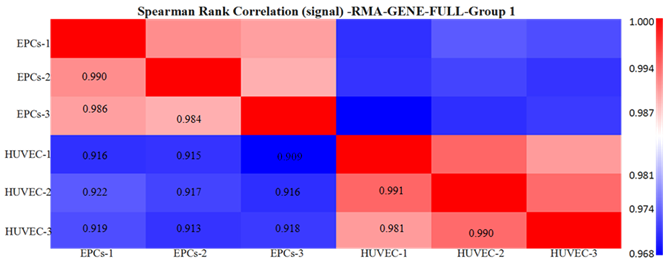
To investigate the homoousia within group and difference between groups, we calculated the Spearman correlation coefficient of each two samples (Figure 1). As shown in Fig. 1a, high correlations were seen within group (e.g., the correlation between EPCs-1 and EPCs-2 was 0.990, the correlation between HUVEC-1 and HUVEC-2 was 0.991), whereas much less correlations were observed between groups (e.g., the correlation between EPCs-1 and HUVEC-1 was only 0.916). All that displayed in Figure 1 showed a high-quality of samples and microarrays in our experiments.
(a)
(b)
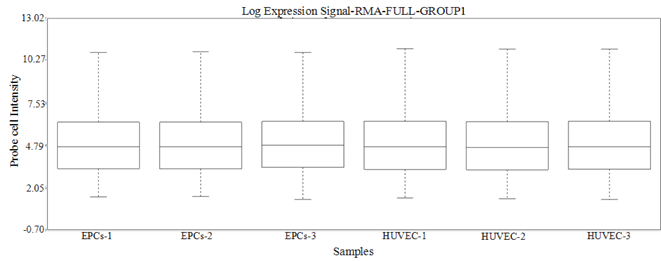
Figure 1. (a) Heatmap of samples: The number in each square in the lower triangle indicates the Spearman rank correlation coefficient between two samples. (b) Box plot: Box plot of RMA summarized probe set signals for all samples.
3.3. Differentially Expressed Genes Between Two Groups
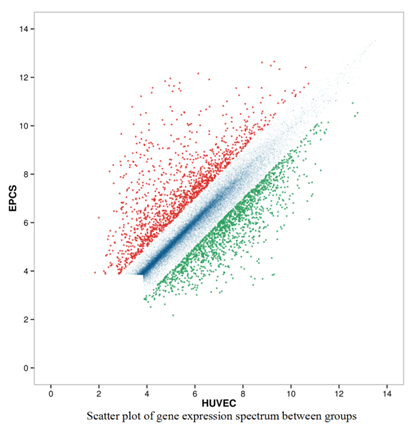
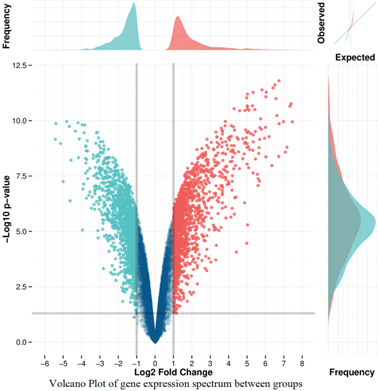
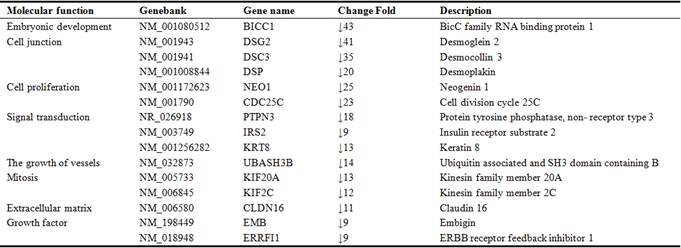
HUVEC as control, the gene expression profiles were detected from six microarray experiments, and indicated that 1354 up-regulated and 1587 down-regulated genes from late EPCs samples respectively (Figure 2). Due to the large number of differentially expressed genes, we only listed part of genes with significant difference (Table 2, Table 3). In addition, the expression levels of four up-regulated and two down-regulated genes selected, as determined by quantitative real-time PCR, were consistent with the microarray results (Figure 3), verifying the accuracy and reliability of microarray data.
(a)
(b)
Figure 2. Scatter plot(a) and Volcano Plot(b) of gene expression spectrum. Plots were constructed using fold-change and p values, enabling visualization of the relationship between fold change (magnitude of change) and statistical significance (which takes both magnitude of change and variability into consideration). The red and green point in the plot represent the up-regulated and down-regulated genes with statistical significance, respectively.
Table 2. Some genes expressing upregulation in late EPCs.
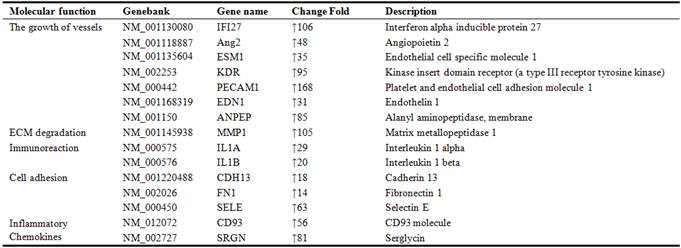
Table 3. Some genes expressing downregulation in late EPCs.
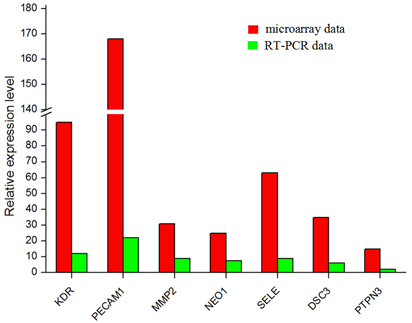
Figue 3. Microarray and quantitative PCR for selected genes (up-regulated genes: KDR, PECAM1, MMP2, NEO1, SELE; down-regulated genes: DSC3, PTPN3). And the quantitative PCR results were consistent with the microarray data.
3.4. Enrichment Analyses of Differentially Expressed Genes
GO analysis revealed the functions of differentially expressed (both up-regulated and down- regulated) genes in EPCs sample (Figure 4). The functions of these genes are related to many processes which are important in angiogenesis, such as blood vessel development, blood vessel morphogenesis, cell migration, as well as molecular functions, including receptor binding, integrin binding, growth factor binding and protein binding.
In addition, Pathway analysis indicated that the up-regulated genes in the EPCs samples participated in Cytokine-cytokine receptor interaction, Cell adhesion molecules, ECM-receptor interaction pathway. However, the down-regulated genes were involved in the alcoholism, Cell cycle, DNA replication pathway (Figure 5).
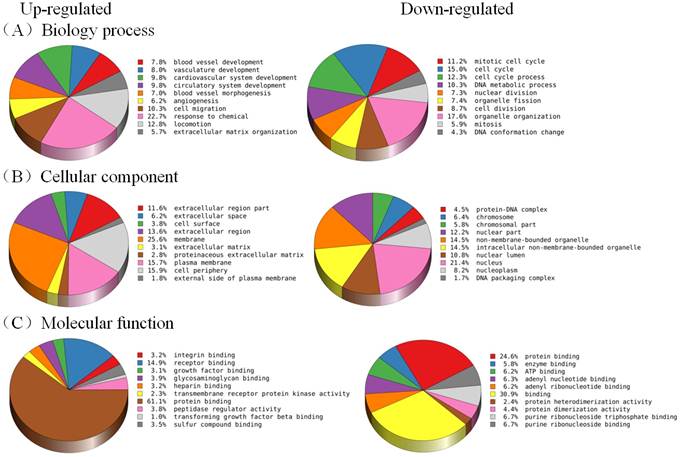
Figure 4. Gene ontology analysis of differentially expressed genes according to (A) biological process, (B) Cellular component, and (C) molecular function. (Left: The top 10 enrichment of up-regulated genes; Right: The top 10 enrichment of down-regulated genes).
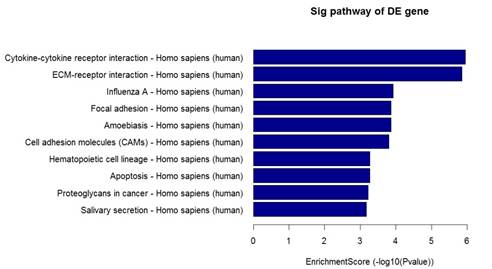
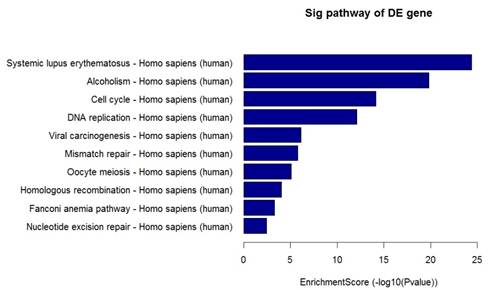
Figure 5. Pathway analysis of differentially expressed genes. (Left: The top 10 enrichment of up-regulated genes; Right: The top 10 enrichment of down-regulated genes.).
3.5. Discussion
In this study, HUVEC as control, we screened 1354 up-regulated and 1587 down-regulated genes in late EPC by using Human Transcriptome Array 2.0. To understand the molecular basis of late EPCs which mobilized from bone marrow incorporating into endothelial injury site and contributing to postnatal angiogenesis further, we analyzed microarray data to screen differentially expressed genes which related to the angiogenesis processes such as the stimulation and migration of endothelial cell, degradation of basal membrane and extracellular matrix (ECM). Therefore, the targets with largest fold changes and smallest p values were deemed possible candidates for further study.
As is known to all, angiogenesis is coordinated by proangiogenic molecules and its ligands firstly. In this study, we found some proangiogenic molecules which up-regulated significantly in late EPCs, such as Ang2, ESM-1, KDR, End1, Eng, et al. Take Ang2 as an example, it had a 48-fold change in EPCs. As a member of Ang, Ang2 can bind to Tie2 specifically. And Ang2 that binds to Tie2 is inducible and secreted by the endothelium. It probably causes destabilization of blood vessels and sprouting of new vessels [13]. Another gene like KDR (VEGFR-2) is the specific receptors of VEGF-A, and the latter is the best recognized and major factor in pathological angiogenesis which could increase vascular permeability and induce EC proliferation, direct migration and differentiation [14]. All these proangiogenic molecules showed a high-fold increase in late EPCs may indicate that EPCs has a better angiogenic ability than other endothelial cells. Secondly, apart from the stimulation of angiogenesis factors, the processes of endothelial cell migrated and incorporated into the injury endothelium sites are also critical for angiogenesis process. And these processes depend on the interaction of cellular adhesion molecules and their ligands, such as PECAM-1, E-Selectin, FN1, Cadherin 13 and DSC2, DSC3, DSG2 which up-regulated and down-regulated significantly in late EPCs samples. Finally, another important process for angiogenesis is the degradation and remodeling of ECM. They are organized by matrix proteinases (e.g., matrix metalloproteinases (MMPs) and cathepsins), lysyl oxidases (LOX/LOXL), and heparanases [15]. In late EPCs samples, we found that the family of MMPs like MMP1, MMP2, MMP10, MMP14, MMP16 all had a high-fold increase.
Moreover, we systematically analyzed the functions of differentially expressed genes by GO annotation and pathway. And found that the changes of gene expression in late EPCs samples were associated with angiogenesis closely, especially the genes with the largest fold changes and the smallest P values we discussed above.
4. Conclusions
HUVEC as control, the differentially expressed genes we screened from late EPCs maybe the molecular basis when late EPCs migrated to mature vascular endothelium and participated in the repair or regeneration of vascular endothelium after mobilized from bone marrow to peripheral blood. And this study may be help to explore areas of potential basic research and clinical application of EPCs.
References
- Carmen Urbich, Stefanie Dimmeler. Endothelial Progenitor Cells: Characterization and Role in Vascular Biology [J]. Circulation Research. 2004, 95(4):343-353.
- Mihail Hristov, Wolfgang Erl, Peter C. Weber. Endothelial progenitor cells: mobilization, differentiation, and homing [J]. Arterioscler Thromb Vasc Biol. 2003, 23(7):1185-9.
- Canan Alkim, Huseyin Alkim, Ali Riza Koksal, et al. Angiogenesis in Inflammatory Bowel Disease [J]. International journal of inflammation. 2015, 1155: 1-10.
- I. D. Pousa, J. Mat e, and J. P. Gisbert. Angiogenesis inflammatory bowel disease [J]. European Journal of Clinical Investigation. 2008, 38:73-81.
- ANN HOEBEN, BART LANDUYT, MARTIN S, et al. Vascular Endothelial Growth Factor and Angiogenesis [J]. Pharmacological reviews. 2004, 56(4):549-80.
- Assmus B. Transplantation of Progenitor Cells and Regeneration Enhancement in Acute Myocardial Infarction (TOPCARE-AMI) [J]. Circulation. 2002, 106(24):3009-17.
- Jianwen Zhu, Xiangwei Cheng, Qianhua Wang, et al. Transplantation of endothelial progenitor cells for improving placental perfusion in preeclamptic rats [J]. Archives of gynecology and obstetrics. 2015, 291(5):1113-9.
- Murohara T, Ikeda H, Duan J, et al. Transplanted cord blood-derived endothelial precursor cells augment postnatal neovascularization [J]. The Journal of clinical investigation. 2000, 105(11):1527-36.
- Jennifer M, Hughes-Large, Nica M. Borradaile. Gene expression microarray data from human microvascular endothelial cells supplemented with a low concentration of niacin. [J]. Elsevier. 2016, 6:899-902.
- Asahara T, Murohara T, Sullivan A, et al. Isolation of putative progenitor endothelial cells for angiogenesis [J]. Science. 1997, 275(5302):964-7.
- Hur J, Yoon CH, Kim HS, et al. Characterization of Two Types of Endothelial Progenitor Cells and Their Different Contributions to Neovasculogenesis [J]. Arteriosclerosis, thrombosis, and vascular biology. 2003, 24(2):288-93.
- Hristov M, Erl W, Weber PC. Endothelial progenitor cells: isolation and characterization. [J]. Trends Cardiovasc Med. 2003, 13(5):201-6.
- U. Fiedler, Y. Reiss, M. Scharpfenecker, et al. Angiopoietin-2 sensitizes endothelial cells to TNF-alpha and has a crucial role in the induction of inflammation [J]. Nature medicine. 2006, 12:235-9.
- N. Ferrara, H. P. Gerber, and J. Le Couter. The biology of VEGF and its receptors [J]. Nature medicine. 2003, 9:669-76.
- E. Shimshoni, D. Yablecovitch, L. Baram, et al. ECM remodeling in IBD: innocent bystander or partner in crime? The emerging role of extracellular molecular events in sustaining intestinal inflammation [J]. Gut. 2015, 64:367-72.


