Synthesis, Characterization and Interaction Studies of Carbohydrizide Derivatives Based Drug with Human Serum Albumin (HSA): Spectroscopic and Molecular Docking Investigations
Labeeb M. Shaif*, Ahmed Ali Al-Hazmi, Sabah Ahmed Abdo Esmail, Waddhaah M. Al-Asbahy, Rowida A. Al-Fkeeh
Department of Chemistry, Ibb University, Ibb, Yemen
Email address

(L. M. Shaif)
*Corresponding author
Citation
Labeeb M. Shaif, Ahmed Ali Al-Hazmi, Sabah Ahmed Abdo Esmail, Waddhaah M. Al–Asbahy, Rowida A. Al-Fkeeh. Synthesis, Characterization and Interaction Studies of Carbohydrizide Derivatives Based Drug with Human Serum Albumin (HSA): Spectroscopic and Molecular Docking Investigations. International Journal of Chemical and Biomedical Science. Vol. 2, No. 3, 2016, pp. 17-27.
Abstract
(2E)-3-(furan-2-yl)-1-(pyridin-4-yl)prop-2-en-1-one1 reacted with 2-cyanoethane-thioamide (2) to afford the corresponding 4-(furan-2-yl)-6-thioxo-1,6-dihydro-2,3'-bipyridine-5-carbonitriles 6. The synthetic potentiality of compounds 6 were investigated in the present study via their reactions with active-hydrogen containing compounds ethyl chloroacetate 8 aiming to synthesize 4-(furan-2-yl)-6-(pyridin-4-yl)thieno[2,3-b]pyridin-3-amines 10 via 6-(alkylthio)-4-(furan-2-yl)-2,3'-bipyridine-5-carbonitriles 9. Compounds 9&10 reacted hydrazine hydrate in EtOH to afford the corresponding 3-amino-4-(furan-2-yl)-6-(pyridin-4-yl)thieno[2,3-b]pyridine-2-carbohydrazide 11. The structures of all newly synthesized heterocyclic compounds were elucidated by considering the data of IR, 1H NMR, mass spectra as well as that of elemental analyses. The binding studies of interaction compound 11 as therapeutic agent with human serum albumin (HSA) has been examined by using of various spectroscopic methods (fluorescence, CD and FTIR) and molecular docking technique which revealed that compound 11 has a strong affinity to binding with HSA. The results of fluorescence titration showed that the compound 11 was quench the intrinsic fluorescence of HSA through a static quenching procedure. Binding constants (Kb), the number of binding sites and corresponding thermodynamic parameters ∆G, ∆H and ∆S at different temperatures were calculated. The molecular docking technique was utilized to ascertain the mechanism and mode of action towards the molecular target HSA indicating that compound 11 was located at the entrance of site I by hydrophobic and hydrogen bonding forces.
Keywords
Carbohydrizide Drugs, Human Serum Albumin (HSA), Fluorescence, Thermodynamic Parameters, Molecular Docking
1. Introduction
Carbohydrazide derivatives has attracted special attention for its therapeutic importance against a wide spectrum of bacterial ailments used primarily as an anti–inflammatory agent in the treatment of inflammatory bowel disease as well as for rheumatoid arthritis [1]. Some carbohydrazide analogs have been displays as potential anti-tubercular [2], anti-convulsant [3], anti-tumor [4] and many of them show appreciable metal chelating drugs for the treatment of genetic disorders such as thalassemia and treating neurodegenerative disorders such as Alzheimer disease [5].
Study of the interaction between drugs and plasma proteins have been an interesting area of research in chemical biology and pharmacology [6]. Binding of a drug to albumin, results in an increased drug solubility in plasma, decreased toxicity, and protection against oxidation of the bound drug. Drugs distribution is mainly controlled by HSA, because most drugs circulate in plasma and reach the target tissues by binding to HSA [7]. Therefore, drug binding to proteins such as HSA has becomes an important determinant of pharmacokinetics, e.g. prolonging in vivo half–life, restricting the unbound concentration and affecting distribution and elimination of the drug [8]. In this regard, HSA is the most extensively studied protein, due to its lack of toxicity and immunogenicity make it an ideal candidate for drug delivery [9]. Additionally, HSA is known to accumulate in tumors, being taken up by tumor cells at increased levels compared to normal cells, and serves as carrier conjugate of various anticancer drugs viz, chlorambucil, paclitaxel and doxorubicin [10]. The main role of HSA is (HSA, 66 kDa) to maintain the colloid osmotic pressure in the blood and also plays a key role in the transport and deposition, distribution, and metabolism of several endogenous and exogenous substances such as fatty acids, nutrients, steroids, metal ions, hormones, enzymes, surfactants and a number of therapeutic drugs through the blood plasma to their molecular target [11, 12]. The crystal structure analysis revealed that the HSA has a 585 amino acid residue monomer and contains three structurally similar domains (I, II, and III), each containing two subdomains (A and B) and is stabilized by 17 disulfide bridges and has 67% of α–helix. HSA contains two principal drug binding sites, Site–I and Site–II and only one tryptophan residue Trp–214 in the sub domain IIA which is capable of binding mostly drugs by strong hydrophobic interactions [13].
In view of the above consideration, in this work, we have synthesized and characterized a new carbohydrazide compound 11 derive from compound 9 and 10 with hydrazine hydrate. The interaction between compound 11 and HSA was investigated by various spectroscopic and molecular docking methods. The fluorescence quenching mechanism of HSA by compound 11 was explored at different temperatures (299, 310 and 318 K) and the binding constants (K), and binding site number (n), corresponding thermodynamic parameters (ΔG, ΔH and ΔS) were calculated. The energy transfer and distance between the acceptor HSA and the donor compound11were calculated by Förster′s theory. Moreover, conformational changes of HSA during the course of binding were ascertained by CD and FTIR measurements.
2. Materials and Methods
2.1. Materials
HSA (fatty acid free, 99%) was purchased from Sigma and used without further purification. All chemicals which used for synthesis compounds were purchased from Sigma, Tris(hydroxymethyl)aminomethane or Tris Buffer (Sigma), were used as received. Doubly distilled water was used as the solvent throughout the experiments. All reagents were of the best commercial grade and used without further purification.
2.2. Sample Preparation
Human serum albumin of 1x10⁻³ M was prepared by dissolving protein in Tris–HCl buffer solution at pH 7.4. The protein concentration was determined spectrophotometrically using an extinction coefficient of 35219 M–1 cm–1 at 280 nm [14]. Stock solution of compound (1x10⁻³ M) was prepared by dissolving compound in doubly distilled water. NaCl (analytical grade, 1M) solution was used to maintain the ionic strength of buffer at 0.1M pH was adjusted to 7.4 by using HCl. Working standard solution was obtained by appropriate dilution of the stock solution.
2.3. Apparatus
Shimadzu FTIR–8201PC Spectrophotometer was used for recording IR spectra of KBr pellets in the range of 400–4000 cm–1. The 1H NMR spectra was obtained on a Varian Mercury 300 MHz spectrometer operating at room temperature. Mass spectra were recorded on Shimadzu GCMS–QP1000EX using an inlet type at 70 eV. Microanalysis of the compounds were obtained on a Carlo Erba Analyzer Model 1108. Emission spectra were recorded with a Hitachi F–2500 fluorescence spectrophotometer. CD spectra were measured on Jasco J–815–CD spectropolarimeter at room temperature.
2.4. General Procedure for the Synthesis of Carbohydrazide Derivatives
2.4.1. Synthesis of 6a,b (General Method)
Method A
A solution of each of 2 (2.6 mmole) and each of 1 (5.8g; 2.6 mmole) in absolute ethanol (30 ml) containing a catalytic amount of piperidine (0.4 ml) heated under reflux for 5 hours. The reaction mixture then evaporated, cooled, triturated with ethanol. The products so formed collected by filtration, washed with cold ethanol, and then crystallized from the proper solvent to give the corresponding 6.
Method B:
A mixture of dispersed sulfur (0.67 g; 1.9 mmole) and morpholine (1.7mL; 1.9 mmole) in 50 mL of ethanol refluxed for 20 minutes. Add malononitrile (7) (1.3g; 1.9 mmole) and 1 (4.54g; 1.9 mmole) and the mixture refluxed for 2 hours. The mixture cooled to ~ 20°C, and 10% HCl added to reach pH 5–6. The precipitates so formed filtered off and washed with water and cooled ethanol then crystallized from dioxane to give the corresponding 6.
4–(2–Furyl)–6–thioxo–1,6–dihydro–2,4'–bipyridine–5–carbonitrile (6):
Orange crystals (65%), m.p. 244°C, IR (ν cm–1):3112 (NH), 3030 (aromatic–CH) and 2214 (CN); MS (z/m) = 279 (M+, 100% which corresponding to the molecular weight), 278 (M+–H, 14.2%); 253 (M+–CN, 1.3%); 252 (M+–H, CN, 3.2%); 246 (M+–SH, 3.2%);246 (M+–H2S, CN4.5%);Anal. for C15H9N3OS (279) Calcd./Found (%): C(64.50/64.76); H(3.25/3.65);N(15.04/15.31); S(11.48/11.18).
4–(4–Methoxyphenyl)–6–thioxo–1,6–dihydro–2,3'–bipyridine –5–carbonitrile (6): as orange crystals, yielded by 76%, m.p. 272°C; IR (ν cm−1): 3174 (NH), 3020 (aromatic–CH) and 2216 (CN); MS: 319 (M+, 100% which corresponding to the molecular weight of the molecular formula C18H13N3OS of the assigned structure), 318 (M+–H, 30.6%), 287 (M+–S, 4.6%); 1H NMR (DMSO–D6) (δppm): 3.855 (s, 3H, OCH3), 7.117–7.841(m, 4H, Ar), and 8.174–9.221 (m, 5H, pyridine H,s); Anal, for C18H13N3OS (319) Calcd./Found(%): C(67.69/67.72), H(4.10/4.14), N(13.16/13.19), and S (10.04/10.11%).
2.4.2. Synthesis of Ethyl [(5–Cyano–4–Phenyl–2,3'–Bipyridin–6–yl)thio] acetate (9): (General Procedure)
A solution of each of 6 (0.32 g, 1 mmole) and ethyl chloroacetate 8 (0.122 g, 1 mmole) in sodium methoxide (prepared from 0.14 g of sodium and methanol 25 mL) was stirring at room temperature for 15 minutes. The formed precipitate was collected by filtration, washed with water and crystallized from the proper solvent to give 9.
Ethyl[(5–cyano–4–phenyl–2,3'–bipyridin–6–yl)thio]acetate (9): as a pale yellow crystals (87%), m.p = 196°C; IR υ(cm–1): 3066.2 (C–H, aromatic), 2220.1 (CN), 1734.6 (ester CO); 1H NMR (DMSO–D6) (δppm): 1.166 (t, 3H, CH2CH3), 2.498 (s, 2H, SCH2), 4.300(q, 2H, CH2CH3), 7.565–7.796(m, 5H, phenyl H,s), 8.070–9.402(m, sH, pyridine H,s); Anal., for C21H17N3O2S (375), Calcd./Found (%): C(67.18/67.23), H(4.56/4.61), N(11.19/11.23), S(8.54/8.61%).
Ethyl {[5–cyano–4–(2–furyl)–2,3'–bipyridin–6–yl]thio}acetate (5i):Pale yellow crystals (80%); m.p = 180°C; IR (ν cm–1): 3058 (C–H aromatic), 2210 (CN), 1737 (ester CO); Anal. for C19H15N3O3S (365), Calcd./Found (%): C(62.45/62.87); H(4.14/4.54); N(11.50/11.21); S(8.78/8.54).
2.4.3. The Synthesis of Ethyl 3–Amino–4–Phenyl–6–Pyridin–3–Ylthieno[2,3–b]Pyridine–2–Carboxylate (10)
Method A:
A solution of each of 9 (0.38g, 1 mmole) in sodium ethoxide solution (prepared from 0.10 g of sodium and 25 mL ethanol) heated under reflux for 30 minutes. The solid that formed after cooling, collected by filtration, washed with water and ethanol then crystallized from the proper solvent to afford 10.
Method B:
A solution of each of 6 (0.32g, 1 mmole) and ethyl–chloroacetate (8) (0.122g, 1mmole) in sodium methoxide (prepared from 0.10g of sodium and 25 mL ethanol) heated under reflux for 2 hours. The solid products so formed after cooling, collected by filtration, washed with water and ethanol and dried then crystallized from the proper solvent to afford 10.
Ethyl 3–amino–4–phenyl–6–pyridin–4–ylthieno[2,3–b] pyridine–2–carboxylate (10):as yellow crystals crystallized from ethanol (90%); m.p = 180°C; IR υ(cm–1): 3478.5, 3333.3 (NH2), 3057 (C–H aromatic),1666.9 (CO);1H NMR (DMSO–D6) (δppm): 1.052 (t, 2H, CH2CH3), 3.443 (q, 2H, CH2CH3), 6.469 (s, 2H, NH2), 7.483–7.897 (m, 5H, phenyl H,s) and 8.572–9.388 (m, 5H, pyridine H,s); Anal, for C21H17N3O2S (375), Calcd./Found (%): C(67.18/67.23), H(4.56/4.61), N(11.19/11.23), and S (8.54/8.60).
Ethyl 3–amino–4–(2–furyl)–6–pyridin–3–ylthieno[2,3–b]pyridine–2–carboxylate (6i): Yellow crystals crystallized from ethanol (90%); m.p = 210°C; IR (ν cm–1): 3499, 3377 (NH2), 3037 (C–H aromatic), 1672 (CO); MS: 365 (M+, 100% which corresponding to the molecular weight), 320 (M+–OEt, 21.3%); 292 (M+–COOEt, 19.1%); Anal. for C19H15N3O3S (365), Calcd./Found (%): C(62.45/62.21); H(4.14/4.32); N(11.50/11.76); S(8.78/8.98).
2.4.4. Synthesis of 3–Amino–4–(Furan–2–yl)–6–(Pyridin–4–yl)Thieno[2,3–b]Pyridine–2–Carbohydrazide (11)
Method A
A solution of each of 9 (0.38g, 1 mmol) in hydrazine hydrate (15mL) and ethanol (20 mL) was heated under reflux for 5 h; the excess solvents were evaporated and cooled. The solid was collected by filtration, dried, and crystallized from the acetic acid to give 11.
Method B
A solution of each of 10 (0.38g, 1 mmol) in hydrazine hydrate (15mL) and ethanol (20 mL) was heated under reflux for 4 h; the excess solvents were evaporated and cooled. The solid was collected by filtration, dried, and crystallized from the acetic acid to give 11.
3–Amino–4–(furan–2–yl)–6–(pyridin–4–yl)thieno[2,3–b]pyridine–2–carbohydrazide(11): as yellow crystals (92%), m.p. = 280°C; IR (ν cm−1): 3463, 3320, 3301, 3230 (NH & NH2), 3044 (aromatic–CH); MS: 351 (M+, 34.3% which corresponding to the molecular weight of the molecular formula C17H13N5O2S of the assigned structure), 320 (M+–NHNH2, 100%); 320 (M+–CONHNH2, 7.4%); 1HNMR (DMSO–D6) (δ ppm): 4.472 (br, s, 2H, NH2); 6.824 (br, s, 2H, NH2); 7.336– 8.700 (m, 7H, pyridinyl H's, furan H’s); 9.393 (br, 1H, NH) and 9.400 (s, 1H, pyridine C5H); Anal, for C17H13N5O2S (351) Calcd./Found (%):C(58.11/58.13) H(3.73/3.76), N(19.93/19.97), S(9.13/9.15).
2.5. HSA–Binding Experiments
2.5.1. Fluorescence Quenching Mechanism
Fluorescence measurements were carried out on Hitachi F–4500 fluorescence spectrophotometer in a 1 cm path–length quartz cell with the excitation and emission wavelength set at 280 and 300–400 nm, respectively. The interaction of compound 11 (0.33–2 x 10⁻⁵ M) with HSA content of fixed concentration (1.00 x 10⁻⁵ M) was studied. The intensity at 350 nm (Tryptophan) was used to calculate the binding constant (K). The fluorescence quenching of HSA at different temperatures (299, 310 and 318 K) were determined using the Stern–Volmer equation [15]:
 (1)
(1)
where Fο and F are the fluorescence intensities in absence and presence of quencher, respectively, [Q] is the quencher concentration, and KSV Stern–Volmer quenching constant, which can be written as:
 (2)
(2)
where kq is the biomolecular quenching rate constant and τo is the average lifetime of the fluorophore (Trp–214) in absence of quencher and its value is around 10–8 sfor most biomolecules [16]. Therefore, Eq. (1) was applied to determine Ksv by linear regression of a plot of Fo/F vs [Q].
2.5.2. Calculation of Binding Constant
The binding constant was calculated from the modified Stern–Volmer equation (Eq. (3))
 (3)
(3)
where Kb is the binding constant of compound 11 with biomolecule which was calculated from the intercept and slope of slopes of the Lineweaver–Burk (1/(Fο–F) versus 1/[Q]) (intercept = 1/Fο, slope = 1/KbFο, so Kb = intercept/slope). Furthermore, the binding constant (K) and number of bound compound 11 to HSA (n) were determined by plotting the double log graph of the fluorescence data using (Eq. (4)).
 (4)
(4)
2.5.3. Determination of Thermodynamic Parameters
The thermodynamic parameters were calculated from the van′t Hoff equation (Eq. (5))
 (5)
(5)
where K is the Lineweaver–Burk static quenching constant at corresponding temperature and R is the gas constant, in which ∆H and ∆S of reaction was determined from the linear relationship between lnK and the reciprocal absolute temperature. Furthermore, the free energy change (∆G) was calculated by the Eq. (6).
 (6)
(6)
2.5.4. Calculations of Energy Transfer
According to Föster resonance energy transfer (FRET), the efficiency of energy transfer (E) is given by [23]:
 (7)
(7)
where F and F0 are the fluorescence intensities of HSA in the presence and absence of quencher, r is the distance between acceptor and donor and R0 is the critical distance when the transfer efficiency is 50%. The value of R0 was calculated using the Eq. (8):
 (8)
(8)
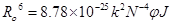
where k2 is spatial orientation factor between the emission dipole of the donor and the absorption dipole of acceptor, N is the refractive index of the medium, ф is the fluorescence quantum yield of the donor and J is the overlap integral of the fluorescence emission spectrum of the donor and the absorption spectrum of the acceptor and calculated by Eq. (9):
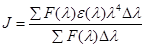 (9)
(9)
where F(λ) is the corrected fluorescence intensity of the donor at wavelength λ and ε(λ) is the molar absorption coefficient of the acceptor at wavelength λ. Under the experimental condition, the value of K2 =2/3, N =1.336, and ф = 0.188 [17].
2.5.5. Circular Dichroism (CD) and Fourier Transform Infrared (FTIR) Measurements
CD spectra were measured on Jasco J–815–CD spectropolarimeter (Jasco, Japan) at room temperature using a 1 cm quartz cuvette. Measurements were taken at wavelengths between 200 and 250 nm. All observed CD spectra were baseline substracted for buffer and the CD results were expressed in terms of MRE (mean residue ellipticity) in deg cm2 d mol–1 as Eq. (10):
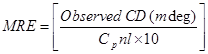 (10)
(10)
where Cp is the molar concentration of the protein, n the number of amino acid residues (585) and l the path length (0.1 cm). The α–helical contents of free and combined HSA were calculated from the MRE value at 208 nm using the Eq. (11) as described by Lu et al. [18]:
 (11)
(11)
where MRE208 is the observed MRE value at 208 nm, 4000 is the MRE of the β–form and random coil conformation cross at 208 nm, and 33000 is the MRE value of a pure α–helix at 208 nm.
Fourier Transform Infrared measurements were carried out on an Interspec 2020 FTIR spectrometers were recorded in liquid phase in 400–4000 cm–1 range.
2.5.6. Molecular Docking
The rigid molecular docking studies were performed by using HEX 6.1 software [19], is an interactive molecular graphics program to understand the drug–protein interaction. The Structure of the compound was sketched by CHEMSKETCH (http://www.acdlabs.com) and converts it into pdb format from mol format by OPENBABEL (http://www.vcclab.org/lab/babel/). The crystal structure of the human serum albumin (PDB ID: 1h9z) was downloaded from the protein data bank (http://www.rcsb.org./pdb). All calculations were carried out on an Intel Pentium 4, 2.4 GHz based machine running MS Windows XP SP2 as operating system. Visualization of the docked pose has been done by using PyMol (http://pymol.sourceforge.net/) molecular graphic program.
3. Results and Discussion
3.1. Synthesis and Characterization
(2E)–3–(furan–2–yl)–1–(pyridin–4–yl)prop–2–en–1–one [20] (1) reacted with 2–cyanoethane–thioamide (2) in absolute ethanol containing a catalytic amount of piperidine under reflux to afford a reaction product. Such reaction product formed via a Michael addition of –CH2– in 2 on –CH=CH– of 1 to give the non–isolable products 3, 4, 5 followed by cyclisation via dehydration and dehydrogenation to give 6. The IR (cm–1) of this reaction product showed the bands of NH (3169.7) and CN (2220) groups. Its mass spectrum gave m/z = 284 (100%) which corresponding to the molecular weight of the molecular formula C15H9N3S of the assigned structure as well as m/z = 251 (12.5%) which corresponding to (M+– SH) (Scheme 1).
A further confirmation of 6 arose from their synthesis through other pathway via the reaction of each of 1 and malononitrile (7) in a dispersed sulfur, morpholine and ethanol under reflux 2 hours[21]. It important to refer here that 6 obtained by the two pathways are identical in all physical and chemical properties (Scheme 1).
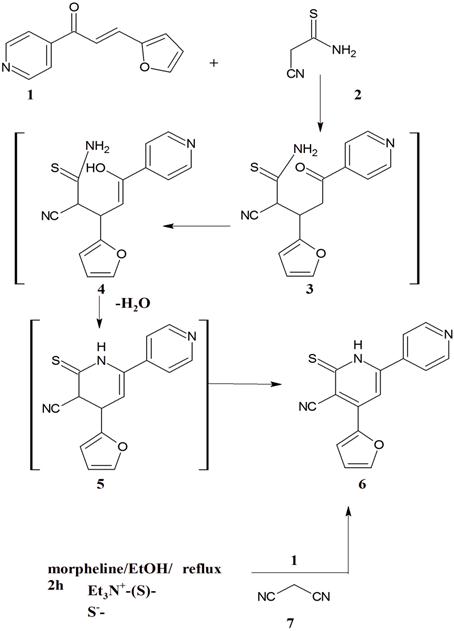
Figure 1. Scheme 1.
The synthetic potentiality of each of 6 investigated through electrophilic substitution reactions using several electrophilc C–species. Thus, it has been found that 1 reacted with ethyl chloroacetate (8) in stirred methanolic sodium methoxide at room temperature for 15 minutes to give a reaction product. The IR (cm–1) of this reaction product showed the bands of CN (2220.1) and CO (1734.6) of the newly introduced COOEt group. Its 1H NMR (d ppm) spectrum revealed the signals of –SCH2–, –COOCH2CH3, –COOCH2CH3 protons and this confirm the good nucleophilicity of S in 6 that facilitate the electrophilic attack of 8 to afford 9 in very pure state and in a good yield. Furthermore, 9 structure elucidated through its cyclisation in ethanolic sodium ethoxide under reflux for 30 minutes to give a reaction product whose IR spectrum showed no bands of CN group and instead the bands of the newly formed NH2 group detected. Also, the 1H NMR spectrum of this reaction product revealed no signals of –SCH2– protons while that of NH2 detected. Considering the data of both IR and 1H NMR we concluded that both –SCH2– and CN functional groups in 9 involved in the cyclisation step to give the finally isolated 10. A further confirmation of 10 structure obtained through its preparation authentically via the reaction of 6 with 8 in ethanolic sodium ethoxide under reflux for 2 hours (cf. Exp. Part).
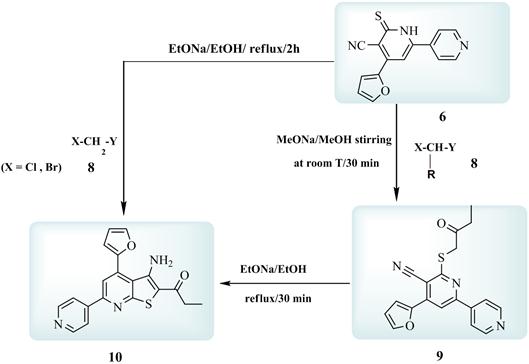
Figure 2. Scheme 2.
3–Amino–4–phenyl–6–pyridin–3–ylthieno[2,3–b]pyridine–2–carbohydrazide (11) synthesized in good and pure yield via the reaction of ethyl {[5–cyano–4–(furan–2–yl)–2,4'–bipyridin–6–yl]sulfanyl}acetate (9) with hydrazine hydrate under reflux for 3–5 hours [21]. The IR (cm–1) of this reaction product showed no bands for CN and CO functions while the newly formed NHNH2 functions detected (cf. Exp. Part). Thus, we concluded that the reaction most probably proceeded via the nucleophilic attack of the hydrazine N atom on the electrophilic C of the COOEt group followed by both removal of ethanol molecule and intramolecular cyclization to afford 11. The structure of 11 was further confirmed chemically by its preparation authentically via reaction of ethyl3–amino–4–(furan–2–yl)–6–(pyridin–4–yl)thieno[2,3b] pyridine–carboxylate (10) with hydrazine hydrate. Mass spectrum used as a physical tool to elucidate 11 structure where it gave peaks at m/z=351 (30.4%) which corresponding to the molecular weight of the molecular formula C17H13N5O2S of the signed structure; m/z= 322 (100%, M+–NHNH2); 294 (19.9%, M+–CONHNH2)(cf.Scheme 3).
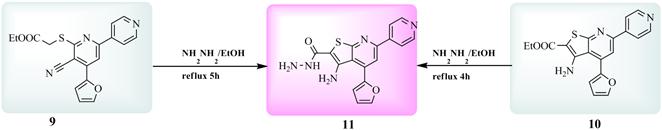
Figure 3. Scheme 3.
3.2. HSA Binding Studies
3.2.1. Fluorescence Quenching of HSA by Compound11
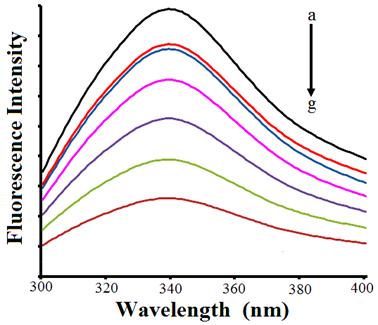
Fluorescence spectroscopy is an effective method to explore the interaction between small molecules and biomacro–molecules. Literature reveals that fluorescence of HSA comes from the tryptophan, tyrosine and phenylalanine residues. Phenylalanine has a very low quantum yield and the fluorescence of tyrosine is almost totally quenched if it is ionized or present near to an amino group, a carboxyl group or a tryptophan. Thus, the fluorescence of HSA is dominated by the residue Trp–214 in subdomain IIA [22]. When small molecular substances bound to HSA, the changes of intrinsic fluorescence intensity of HSA are induced by the microenvironment of Trp residue. The fluorescence emission spectra of HSA at various concentration of compound 11 is shown in Fig. 4a. HSA showed a strong fluorescence emission with a peak at 350 nm at λex = 280 nm, while compound 11 has no intrinsic fluorescence under the present experiment conditions. Upon increasing the concentration of compound 11,caused a reduction of the fluorescence intensity. The strong quenching of HSA fluorescence clearly indicated compound 11 was bound to HSA which changed the microenvironment of tertiary structure of HSA [23].
The fluorescence intensity of a compound can be decreased by a variety of molecular interactions, such as excited–state reactions, molecular rearrangements, energy transfer, ground–state compound formation and collision quenching. Collisional or dynamic quenching refers to a process that the fluorophore and the quencher come into contact during the lifetime of the excited–state, whereas static quenching refers to fluorophore–quencher compound formation [24].
In order to ascertain the fluorescence quenching mechanism, the fluorescence quenching data at different temperatures (298, 310and 318 K, Fig. 4b) were analyzed using the classical Stern–Volmer equation. The results (Table 1) showed that the Stern–Volmer quenching constant Ksv is inversely correlated with temperature, and the values of kq being larger than the limiting diffusion constant Kdif of the biomolecule (Kdif = 2.0 × 10¹⁰ M−1s−1), suggested that the fluorescence quenching was caused by a specific interaction between HSA and compound 11, and the quenching is not initiated by dynamic collision but arisen mainly due to the compound formation [25].
Table 1. Stern–Volmerquenching constant of the compound 11–HSA system at different temperatures.
| pH | T (K) | Ksv (105M–1) | kq (1013M–1s–1) |
| 7.40 | 299 | 3.21 | 3.21 |
| 310 | 1.11 | 1.11 |
| 318 | 0.64 | 0.64 |
(a)
(b)
(c)
Fig. 4. (a) Fluorescence quenching spectra of HSA (1.0 x 10⁻⁵ M) by different concentrations of compound 11 corresponding to 0.33–2x 10⁻⁵ M with the excitation wavelength at 280 nm in 5 mM Tris_HCl/50 mM NaCl buffer, pH 7.4, at room temperature. Arrow shows the intensity changes upon increasing concentration of the quencher. (b) Stern–Volmer plots showing HSA tryptophan quenching caused by compound 11 at three different temperatures. (c) Lineweaver–Burk plot for the binding of HSA with compound 11 at different temperatures.
3.2.2. Binding Constants and the Number of Binding Sites
For the static quenching process, the quenching data were analyzed according to the modified Stern–Volmer equation (Eq. (3)). As shown in Fig. 4c, the binding constant decreased with increasing temperature (see Table 2), which coincided with the Stern–Volmer quenching constant. As static quenching, the quenching constant can be interpreted as the association constant of the compound action reaction since static quenching occurs from the formation of a ground state compound which is non–fluorescent or weakly fluorescent between fluorophore and quencher.
When small molecules bind independently to a set of equivalent sites on a macromolecule, the equilibrium between free and bound molecules is given by the Eq. 4. The binding constants Kb and binding sites "n" were calculated by the slopes of the static quenching equation (log (F0–F)/F versus log [Q])curves as shown in Fig. 5a and the results have been summarized in Table 1. The binding constants decreased with increasing temperature, which coincided with the Lineweaver–Burk, Stern–Volmer quenching constants.
Table 2. Binding constant (Kb), the number of binding sites (n) and ∆G values for the compound 11–HSA system at different temperatures.
| pH | T (K) | Kb(105M–1) | n | ∆G (kJ/mole) |
| 7.40 | 299 | 5.77 | 1.23 | –32.866 |
| 310 | 4.980 | 1.14 | –33.592 |
| 318 | 4.833 | 1.04 | –34.585 |
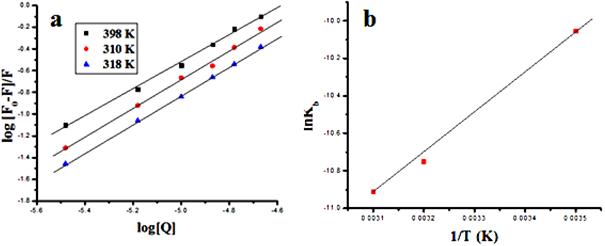
Fig. 5. (a) Logarithmic plot of the fluorescence quenching of HSA at different temperatures. (b) Van′t Hoff plot for the interaction of compound 11 and HSA.
3.2.3. Thermodynamic Parameters and Nature of the Binding Forces
The interacting molecular forces between compound 11 and HSA exhibit weak interactions such as electrostatic forces, hydrophobic interaction, hydrogen–bond formation, van der Waals forces and stereo–hindrance effect, etc. [26]. The thermodynamic parameters, enthalpy change (∆H), entropy change (∆S) and free energy change(∆G) are the main evidence for confirming the binding modes. From the thermodynamic standpoint, ∆H> 0 and ∆S> 0 implies a hydrophobic interaction; ∆H< 0 and ∆S< 0 reflects the van der Waals force or hydrogen bond formation; and ∆H≈0 and ∆S> 0 suggests an electrostatic force. The positive ∆S value is frequently taken as evidence for hydrophobic interaction. Furthermore, the negative ∆H value observed cannot be mainly attributed to electrostatic interactions since for electrostatic interactions ∆H is very small, almost zero. A negative ∆H value is observed whenever there is hydrogen bond on the binding site [27]. It is not possible to account for the thermodynamic parameters of the compound 11–HSA coordination compound on the basis of a single intermolecular force. Consequently, the negative ∆H (–1.005KJ/mole) and positive ∆S (+131.3 J/mole K) values suggest that hydrophobic and hydrogen bond interactions play major roles in the compound 11–HSA binding reaction and contributed to the stability of the compound. The negative value of ∆G reveals that the interaction process is spontaneous (Fig. 5b and Table 2).
3.2.4. Energy Transfer Between Compound 11 and HSA
Fluorescence energy transfer occurs via overlapping of emission spectrum of a fluorophore (donor) overlaps with the absorption spectrum of another molecule (acceptor). The overlap of the absorption spectrum of the compound 11 with the fluorescence emission spectra of free HSA is shown in Fig. 6. The rate of energy transfer depends on: (i) the extent of overlapping between fluorescence emission spectrum of donor and the absorption spectrum of acceptor, (ii) the relative orientation of the donor and acceptor dipoles, and (iii) the distance between the donor and the acceptor. Here the donor and acceptor were HSA and the compound 11, respectively. From Eqs. (7)–(9), the value of E, R0, r and J were calculated and found to be 0.87, 2.45 nm, 3.8 nm and 1.54×10⁻¹⁴M–1 cm3, respectively. The donor to acceptor distance r < 7 nm indicated that the energy transfer from tryptophan residue in HSA to compound 11 occur with high probability [28]. Which is also in accordance with the conditions of FRET, indicating the static quenching interaction between compound 11 and HSA.
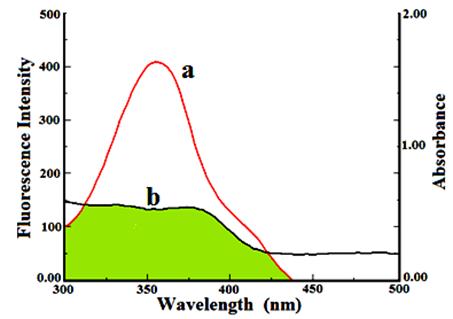
Fig. 6. The overlap of UV absorption spectra of compound 11 with the fluorescence emission spectra of HSA.(a) The fluorescence emission spectrum of HSA (1.0 x 10⁻⁶ M); (b) the UV absorption spectrum of compound 11 (0.90×10⁻⁵ M).
3.5.5. Changes of the Protein’s Secondary Structure Induced by Compound 11
To ascertain the possible influence of compound 11 binding on the secondary structure of HSA, CD measurement was performed in the presence of compound 11 at different concentrations. As shown in Fig. 7, CD spectra of free HSA (line a) exhibit two negative bands in the ultraviolet region at 208 and 222 nm are contributed to n→π* transfer for the peptide bond of α–helix [45]. It was observed that in presence of compound 11 the CD signal of HSA increased. The increase of the CD signal indicates decrease of helical secondary structure content. This phenomenon is like with the interaction of HSA with compound 11. However, the CD spectra of HSA in the presence or absence of compound 11is similar in shape, indicating that the structure of HSA is also predominantly α–helical. From above Eqs 10 and 11, the quantitative analysis results of the α–helix in the secondary structure of HSA were obtained. They differed from that of 59.29% in free HSA to56.54% in the compound 11–HSA conjugate at pH 7.4 and temperature 25°C. The α–helix gradually decreases in presence of compound 11, which reveals that the interaction between compound 11 and HSA leads to a change of the protein′s secondary structure [28].
To further understand the structural alternations of HSA induced by the binding of compound 11 to HSA, FT–IR spectroscopy were performed on HSA and compound 1–HSA system (Fig. 8a and b). The spectrum in Fig. 5(a) was obtained by subtracting the absorption of the Tris–HCl from the spectrum of the protein solution. The spectrum in Fig. 5(b) was obtained by subtracting the absorption of the compound 11–free form from that of the compound 11–bound form. Infrared spectra of proteins exhibit a number of the amide bands, which represent different vibrations of the peptide moiety. Among these amide bands of the protein, amide I peak position occur in the range 1600–1700 cm–1 (mainly C=O stretch) and amide II band in the region 1500–1600 cm–1 (C–N stretch coupled with N–H bending mode). The amide bands have a relationship with the secondary structure of protein, and amide I is more sensitive than amide II for change of secondary of protein [29]. As shown in Fig. 5, the peak position of amide I band was shifted from 1653.2 cm–1to 1641.1cm−1, implicating that that the secondary structure of the HSA protein altered due to interaction of compound 11.
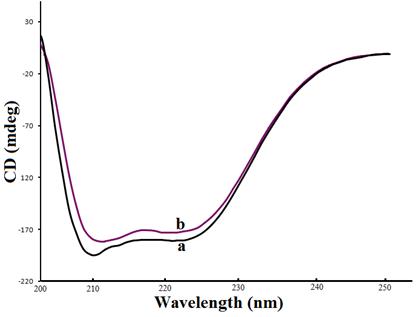
Fig. 7. CD Spectra of the HSA–compound 11 conjugate. (a) 1.0 x 10⁻⁵M HSA; (b) 1.0 x 10⁻⁵M HSA + 1.5 x 10⁻⁵M compound 11.
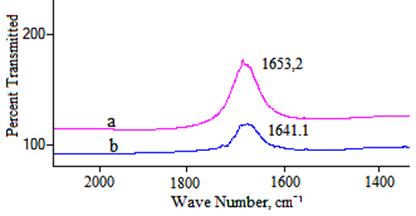
Fig. 8. FT–IR spectra of (a) free HSA; (b) different spectra [(HSA solution + compound 11 solution)–(compound 11 solution)] in 5 mM Tris–HCl/50 mM NaCl buffer, pH 7.4, at room temperature in the region of 1750–1400 cm–1, [HSA], 1.0 x 10⁻⁵ M; [compound 11], 1.5 x 10⁻⁵ M.
3.2.6. Molecular Modeling Study of the Interaction Between HSA and Compound 11
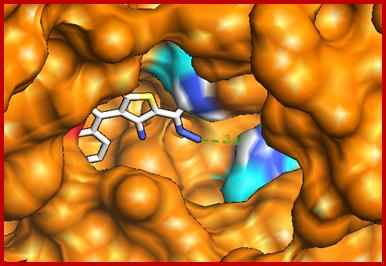
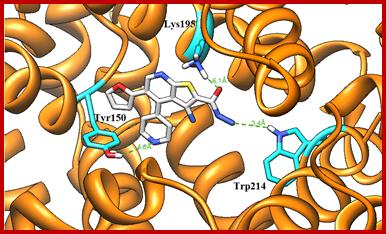
Molecular docking technique was further employed to understand the interaction between compound 11and HSA. Descriptions of the 3D structure of crystalline albumin have revealed that that HSA comprises three homologous domains (denoted I, II, and III): I (residues 1–195) II (196–383) and III (384–585); each domain has two subdomains (A and B) that assemble to form heart shaped molecule(Fig. 9). The principal region of drug binding sites of HSA are located in hydrophobic cavities in subdomain IIA and IIIA, which are corresponding to site I and site II, respectively and tryptophan residue (Trp–214) of HSA in subdomain IIA [30]. There is a large hydrophobic cavity in subdomain IIA to accommodate the compound 11, which play an important role in absorption, metabolism, and transportation of HSA. The results (Fig.10a&b) revealed that the compound 11 was half–surrounded within subdomain IIA hydrophobic cavity, and it is in close proximity to hydrophobic residues, such as Trp214, Lys195, Tyr150, Ala194, His242, Cys200, etc., of subdomain IIA of HSA, suggesting the existence of hydrophobic interaction between them. Hence, this finding provides a good structural basis to explain the efficient fluorescence quenching of HSA emission in the presence of the compound 11. Furthermore, there are also a number of weak electrostatic interactions and hydrogen bonds, because several ionic and polar residues in the proximity of the ligand play an important role in stabilizing the molecule via H–bonds and weak electrostatic interactions. The results obtained from molecular docking indicated that the interaction between compound 11 and HSA was dominated by hydrophobic forces as well as hydrogen bonds, which was consistent with our experimental results.
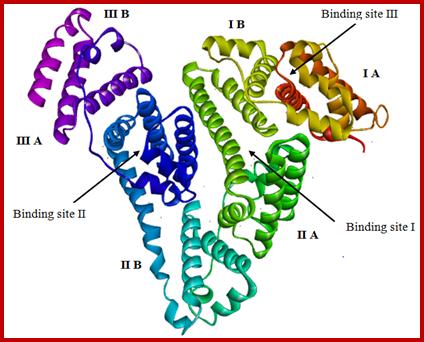
Fig. 9. X–ray crystallographic structure of HSA (PDB ID: 1h9z). The domains and subdomains were displayed with different color, the every subdomain and classical binding site were marked in the corresponding location.
(a)
(b)
Fig. 10. Molecular docked model of (a) compound 11 (stick representation) located within the hydrophobic pocket in subdomain IIA of HSA. (b) The interaction mode between compound 11 (showing stick representation) and HSA (cartoon form) and the green dashed line showing hydrogen bond interaction between them.
4. Conclusion
In the present work, we have synthesized and characterized of 3-amino-4-(furan-2-yl)-6-(pyridin-4-yl) thieno[2,3-b]pyridine-2-carbohydrazide 11 derive from compound 9 and 10 with hydrazine hydrate. The interaction between compound 11 and HSA was investigated employing different spectroscopic (fluorescence, CD, FTIR) and molecular docking techniques. The experimental results indicated that the compound 11 binds to HSA with moderate affinity and the intrinsic fluorescence of HSA was quenched through static quenching mechanism. The binding parameters were calculated using the modified Stern–Volmer equation. The thermodynamic parameters, negative value of ∆H, positive value of ∆S and the negative value of ∆G indicate that hydrophobic and hydrogen bonding interactions playing a major role in the binding process located within site I (subdomain IIA). The distance (r) between Trp–214 of HSA and compound 11 was evaluated as r = 3.8 nm, in accordance with Förster non–radioactive resonance energy–transfer theory. Furthermore, CD and FT–IR evidences show that the secondary structure of HSA was changed after compound 11was bound to HSA. Our results may provide valuable information to understand the mechanistic pathway of drug delivery and to pharmacological behavior of drug.
References
- José C. Arthur B., Neira G., Juan R., Rosario R., Abraham V., Robert G., Jaime C., Bioorg. Med. Chem. 19 (2011) 2023.
- Miller L. H., Baruch D. I., Marsh K., Doumbo O. K., Nature (London) 415 (2002) 673.
- Almasirad A., Tabatabai S. A., Faizi M., Kebriaeezadeh A., Mehrabi N., Dalvandi A., Shafiee A., Bioorg. Med. Chem. Lett. 14 (2004) 6057.
- Sellamuthu A., Anup P., Rajendran R., M. Fátima C., Guedes da S., Anjali A. K., Armando J. L. P., Inorganica Chimica 423 (2014) 183.
- Jamshed I., Aamer S., Syed J. A. S., Mariya A., Shams-ul M., Med. Chemistry 12 (2016) 74.
- Sartaj T., Waddhaah M. A., Mohd. A., Farukh A., J.Photochem.Photobio. B: Biology114 (2012) 132.
- Faridbod F., Ganjali M. R., Larijani B., Riahi S., Saboury A. A., Hosseini M., Norouzi P., Pillip C., Spectrochimica Acta Part A. 78 (2011) 96.
- Yokoyama M., J. Artif. Organs 8 (2005)8, 77.
- Haag R., Kratz F., Angew. Chem., Int. Ed. 45 (2006) 1198.
- Chuang V. T. G., Kragh-Hansen U., Otagiri M., Pharm. Res. 19 (2002) 569.
- Shahabadi N., Maghsudi M.,J. Mol. Struct. 929 (2009) 193.
- Jain R. K., Cancer Res. 50 (1990) 814s.
- Ang W. H., Daldini E., Juillerat-Jeanneret L., Dyson P. J., Inorg. Chem., 46 (2007) 9048.
- Pace C. N., Vajdos F., Fee L., Grimsley G., Gray T., Protein Sci. 4 (1995) 2411.
- Trynda-Lemiesz L., Keppler B. K., Koztowski H., J. Inorg. Biochem.73 (1999) 123.
- Lakowicz J. R., Principles of fluorescence spectroscopy, 2nd ed., Plenum Press, New York (1999) pp. 237–265.
- Förster T., Ann. Phys. (Leipzig) 437 (1948) 55.
- Lu Z. X., Cui T., Shi Q. L., 1st ed., Science Press (1987) pp. 79–82.
- Ritche D. W., Venkataraman V., Bioinformatics, 26 (2010) 2398.
- Engler C., Engler A. , Berichte der Deutsehen Chemischem; 1902) (xxxv) 4061.
- Fawzy A. A, Phosphorous, Sulfur and Silicon 126 (1997) 27.
- Feng X. Z., Bai C. L., Lin Z., Anal. Chem. 26 (1998) 154.
- Trynda-Lemiesz L., Keppler B. K., Koztowski H., J. Inorg. Biochem., 73 (1999) 123.
- Lakowiza J. R, Weber G., Biochemistry12 (1973) 4161.
- Zhang G. W., Que Q. M., Pan J. H., Guo J. B., J. Mol. Struct.881 (2008) 132.
- Zhang Y. Z., Zhou B., Liu Y. X., Zhou C. X., Ding X. L., Liu Y., J. Fluorescence18 (2008) 109.
- Ross P.D., Subramanian S., Biochemistry 20 (1981) 3096.
- Cui F. L., Fan J., Ma D. L., Liu M. C., Chen X. G., Hu Z. D., Anal. Lett.26 (2003) 2151.
- Cui F. L., Fan J., Li J. P., Hu Z. D., Bioorg. Med. Chem., 12 (2004) 151.
- Surewicz W. K., Mantsch H. H., Chapman D., Biochemistry 32 (1993) 389.
- Carter D. C. He X. M., Twigg P.D., Broom M. B., Miller T. Y., Science 244 (1989)1195.


