Proximate Composition and Antihyperglycaemic Effects of Selected Plant Products
Philippa C. Ojimelukwe1, *, Nuria Amaechi1, Doris Akachukwu2
1Department of Food Science and Technology, Michael Okpara University of Agriculture Umudike, Umuahia, Nigeria
2Department of Biochemistry, Michael Okpara University of Agriculture Umudike, Umuahia, Nigeria
Email address

(P. C. Ojimelukwe)
*Corresponding author
Citation
Philippa C. Ojimelukwe, Nuria Amaechi, Doris Akachukwu. Proximate Composition and Antihyperglycaemic Effects of Selected Plant Products. International Journal of Chemical and Biomedical Science. Vol. 2, No. 4, 2016, pp. 28-33.
Abstract
The proximate, dietary fibre, mineral and antinutrient compositions of Gongronema latifolium (leaves), Gymnema sylvestre (leaves), Corchorus olitorius (leaves) and Bulchozia coriceae (seeds) were evaluated. Diabetes was induced in selected albino rats while the control groups were normal. Both groups were fed diets containing different levels of each plant product (0, 2.5, 5.0, 10.0 and 20.0% respectively) for twenty-eight days. Effects of plant products on blood glucose, sodium, potassium, phosphorus, calcium and magnesium levels of experimental animals were evaluated. The crude protein, fat, dietary fibre and carbohydrate composition of the four plant products were significantly (p<0.05) different. Insoluble and soluble dietary fibre were significantly (p<0.05) higher in G. sylvestre and G. latifolium respectively. Sodium and potassium levels were highest in C. olitorius. Saponin content was highest in G. latifolium. There was a dose-dependent decrease in blood glucose and sodium concentration in all the diets groups. C. olitorius fed-diet reduced mean body weights of experimental animals throughout the four weeks of study.
Keywords
Proximate, Diabetes, Antinutrients, Mineral, Dietary Fibre
1. Introduction
Diabetes is a group of metabolic disorders resulting from impaired pancreatic function where production and function of insulin is either limited, impaired or ceases altogether [1]. The most common form of diabetes is the type 2 diabetes. Treatment and management of diabetes has remained a great challenge for decades [2]. Type 2 diabetes mellitus may be aggravated by the presence of diseases like obesity, hypertension and other factors like aging and lack of adequate exercise [3,4]. Worldwide, the number of diabetes patients has been extrapolated to double its present status of over 200 million people by the year 2030 [5,6]. Nutrition and lifestyle modification are known to influence an individual’s susceptibility to diseases including diabetes [2]. Previous researchers have reported a significant reduction in type 2 diabetes mellitus under conditions of body mass control and exercise [7,8]. In diabetes, the role of diet is to provide sufficient calories to maintain ideal body weight and minimize associated complications [9].
Human health is inextricably linked to diet and many foods have nutraceutical effects [10]. Nutraceuticals are involved in the treatment and management of diseases including cancer, arthritis and even diabetes [11]. Some plant products with the potentials for the control/management of type 2 diabetes exist in different cultural settings but most of them have not been scientifically evaluated for their efficacy. The present research investigates the antihyperglycaemic effects of four plant products namely: Gongronema latifolium, Corchorus olitorius, Bulchozia coriceae and Gymnema sylvestre.
2. Materials and Methods
2.1. Plant Materials
Fresh matured leaves of the plants (Gongronema latifolium, Corchorus olitorius, and Bulchozia coriceae) were obtained from Umuahia main market, Abia state, Nigeria. Gymnema sylvestre was obtained from Bioresource Development Conservation Programme Centre (BDCPC) Aku, Enugu state, Nigeria. They were thoroughly cleaned, sun-dried, ground in a Thomas Wiley Laboratory Mill (Model 4 USA) and stored for subsequent use in glass containers with screw lids.
2.2. Proximate, Mineral and Phytochemical Analysis
Protein, fat, crude fiber, moisture and ash contents of plant products were determined by standard AOAC methods [12]. Carbohydrate was estimated by difference. Sodium, potassium, calcium, magnesium and phosphorus were determined as described by Pearson [13]. Sodium and potassium were analyzed with the flame photometer. Calcium and magnesium were determined using the Vernasate (EDTA) Complexometric titration method, while phosphorus was determined using the spectrophotometer (Spectronic 21). The method of Price and Butler [14] was used for the determination of tannin content. Phytate was determined using the method of Thompson and Erdman [15]. Oxalates were analyzed by the method Ukpabi and Ejidoh [16]. Saponin was determined by the method of Agrawal [17]. Trypsin inhibitor activity was determined by the method of Kakade et al. [18]. Dietary fiber was determined by the method described by James [19].
2.3. Animal Feeding Experiments
Formulation of diets,
Experimental diets were formulated to incorporate 0-20% of the dried pulverized plant products in each case (see table 1).
Table 1. Experimental diets.
| Ingredients (g) | Diet 1 | Diet 2 | Diet 3 | Diet 4 | Control diet |
| Carbohydrate | 81.70 | 81.70 | 81.70 | 81.70 | 81.70 |
| Protein | 11.30 | 11.30 | 11.30 | 11.30 | 11.30 |
| Fat | 2.00 | 2.00 | 2.00 | 2.00 | 2.00 |
| Fiber | 3.00 | 3.00 | 3.00 | 3.00 | 3.00 |
| Vitamins and minerals | 2.00 | 2.00 | 2.00 | 2.00 | 2.00 |
| Gongronema latifolium | 2.50 | 5.00 | 10.00 | 20.00 | - |
| Bulchozia coriceae | 2.50 | 5.00 | 10.00 | 20.00 | - |
| Gymnema sylvestre | 2.50 | 5.00 | 10.00 | 20.00 | - |
| Corchorus olitorius | 2.50 | 5.00 | 10.00 | 20.00 | - |
Wistar albino rats of 5 weeks old and weighing 54-81g were used for the study. They were divided into 5 groups of 5 animals each. The controls consisted of non-diabetic rats fed diets without plant products and diabetic rats (induced with alloxan) fed diets without plant products. The treatment diets contained 2.5, 5.0, 10.0 and 20.0 per 100g diet of each of the plant products respectively.
2.4. Blood Parameters
Blood glucose was estimated by the method described by Trinder [20]. Oral glucose tolerance and triglycerides were determined by the method of Fossato [21]; while total cholesterol and high density lipoprotein were estimated by the method of Tiez [22]. Low density lipoprotein was determined by the method of Friedewald et al. [23]. Serum potassium, sodium and phosphorus were determined by the method of Terri and Sessin
[24], Marina [25] and Henry et al. [26] respectively.
3. Result
Table 1 presents the proximate composition of the plant products. G. sylvestre had the highest amount of crude protein and ash (39.69% and 14.70% respectively) while B. coriceae had the lowest amount of protein and ash (13.28% and 4.53% respectively). The protein, fat, fibre and carbohydrate compositions of the different plant diets were statistically different.
Table 2. Proximate Composition of Plant Products used for Experiments.
| Plant product | Protein (%) | Fat (%) | Ash (%) | Moisture (%) | Fiber (%) | Carbohydrate (%) |
| Bulchozia coriceae | 13.82 ±0.38d | 2.50 ±±0.06c | 4.53 ±0.07d | 1.34 ±0.02b | 1.74 ±0.09d | 77.18 ±0.27a |
| Gymnema sylvestre | 39.69 ±0.53a | 3.47 ±0.09b | 14.70 ±0.13a | 1.22 ±0.01c | 4.10 ±0.12b | 36.82 ±0.68d |
| Gongronema latifolium | 18.10 ±0.39c | 2.03 ±0.03d | 12.80 ±0.03c | 1.84 ±0.10a | 4.63 ±0.12a | 60.60 ±0.48b |
| Corchorus olitorius | 24.10 ±0.44b | 4.06 ±0.07a | 13.33 ±0.09b | 1.80 ±0.02a | 3.87 ±0.09c | 52.85 ±0.59c |
| LSD 0.05 | 1.43 | 0.21 | 0.29 | 0.05 | 0.34 | 1.71 |
Fig. 1. Dietary fibre content of plant products.
Figure 1 shows the dietary fibre content of the dried plant products. Total and insoluble dietary fibre contents were significantly higher (p<0.05) in G. sylvestre while soluble dietary fiber was significantly higher in G. latifolium (2.35%). Corchorus olitorus contained the lowest soluble dietary fibre. Insoluble dietary fibre content of Bulchozia coriceae was much lower than that of other plant products (p<0.05)
Fig. 2. Mineral composition of plant products.
Figure 2 shows the mineral content of the dried plant products. C. olitorius contained the highest concentrations of Na and K while G. latifolium contained Calcium and Magnesium in the highest amount. G. sylvestre had the highest quantity of phosphorus.
Fig. 3. Antinutrient content of plant products.
Figure 3 shows the antinutrient content of the dried plant products. B. coriceae and G latifolium were particularly rich in saponins (4.03% and 4.38% respectively) while C. olitorius contained significant amounts of oxalates (1.41%).
The effect of the plant product diets on blood glucose and electrolytes of experimental animals is shown in Table 2. There was a dose-dependent decrease in blood glucose concentration in all the groups of experimental animals. Blood sodium concentration decreased in a dose-dependent manner in all the experimental animals fed different diets. The G. sylvestre diets gave a dose-dependent reduction in blood potassium concentration while B. coriceae diet gave a dose-dependent increase. Blood phosphorus concentration was increased with increasing concentration of the G. latifolium diet.
Table 3. Effect of dried plant Products on Blood glucose and Electrolytes of experimental Animals.
| Group | Blood glucose (mg/dl) | Sodium (mg/dl) | Potassium (mg/dl) | Phosphorus (mg/dl) |
| GL1 | 124.32 ±7.54 | 151.44± 5.09 | 5.10± 0.02 | 2.85± 0.01 |
| GL2 | 119.28 ±2.75 | 152.31 ±2.92 | 4.78 ±0.43 | 3.10± 0.01 |
| GL3 | 115.50± 5.62 | 120.66 ±2.09 | 3.03± 0.02 | 3.96± 0.01 |
| GL4 | 100 48 ±4.83 | 96.16 ±2.98 | 2.23± 0.04 | 4.48 ±0.05 |
| NC | 142.16 ±9.81 | 230.03 ±4.07 | 4.15 ±0.04 | 1.93 ±0.06 |
| PC | 101.50 ±2.30 | 144.80 ±4.40 | 4.07± 0.09 | 3.03 ±0.01 |
| GS1 | 107.11 ±5.79 | 156.69 ±7.70 | 4.44± 0.12 | 2.84± 0.01 |
| GS2 | 101.52 ±7.77 | 149.59 ±4.77 | 4.83 ±0.18 | 3.11± 0.0 |
| GS3 | 98.61 ±7.55 | 145.34 ±9.26 | 4.64 ±0.24 | 3.38 ±0.06 |
| GS4 | 90.52 ±7.80 | 138.85 ±4.89 | 4.34± 0.19 | 3.11± 0.0 |
| CO1 | 109.87 ±3.46 | 157.02 ±3.60 | 3.26± 0.04 | 3.38± 0.06 |
| CO2 | 101.07 ±4.60 | 146.74 ±4.16 | 3.61± 0.04 | 2.68 ±0.0 |
| CO3 | 97.27 ±7.36 | 136.34 ±7.55 | 3.60± 0.08 | 2.92 ±0.01 |
| CO4 | 82.68 ±4.93 | 112.14± 4.76 | 4.59± 0.11 | 3.04± 0.01 |
| BC1 | 86.21 ±7.53 | 150.61± 2.49 | 3.83± 0.00 | 2.53± 0.02 |
| BC2 | 83.05 ±3.17 | 147.79± 3.64 | 4.04± 0.04 | 2.80± 0.0 |
| BC3 | 82.00± 4.33 | 144.66 ±3.88 | 4.27± 0.05 | 3.03± 0.05 |
| BC4 | 78.61± 2.45 | 133.20 ±2.69 | 4.97± 0.22 | 3.25 ±0.01 |
| Normal range | 65-100 mg/dl | 135-155 mg/dl | 3.4-5.3 | 2.7-4.5 mg/dl |
| LSD 0.05 | 16.55 | 13.98 | 0.43 | 0.42 |
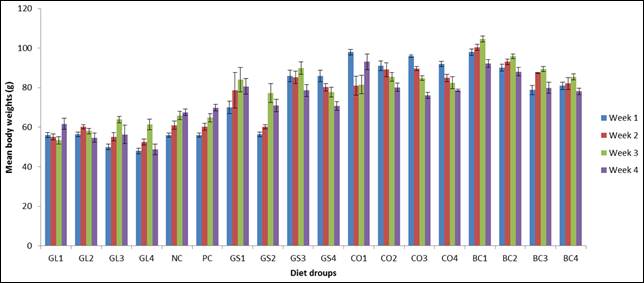
Fig. 4. Mean body weights of experimental diets.
Figure 4 shows the mean body weights of the experimental animals. Mean body weights of experimental animals decreased as the concentration of plant products increased. G. latifolium had the most significant effect in weight reduction when compared with the other plant products
4. Discussion
The high level of crude protein and ash content in G. sylvestre indicates that it could be a good source of cheap and affordable dietary proteins and minerals. Proteins are essential for the biosynthesis of vital body structural components such as antibodies, hormones and so on [27]. The low moisture content of all the plant products indicates that the samples are in a dry state.
Ingestion of foods rich in dietary fibre has been reported to modulate diabetes by reducing appetite and enhancing weight loss [28]. Post et al. [29] reported that foods rich in fibre are good modulators postprandial hyperglycaemia. High insoluble fibre diets have also been reported to reduce diabetes risks by enhancing insulin sensitivity [2]. The dietary fibre content of these plants could be responsible for their use in diabetic control in ethnomedicine.
Minerals play vital physiological roles in human nutrition [30]. Sodium is necessary for maintenance of acid-base balance, nerve and musces activity [31]. Potassium, phosphorus and calcium are needed for growth and development of bones and muscles, while magnesium aids calcium metabolism in bones [32]. The result indicates that C. olitorius is a good source of sodium and potassium.
Certain phytochemicals or antinutrients such as tannins, oxalates and phytates present in plant products limit bioavailability and minerals and proteins in diet [33]. They combine with minerals to form complexes. The levels of antinutrient in the plant products in this study is relatively low and can be eliminated by processing methods such as cooking [34].
The overall dose dependent reduction in blood glucose concentration in all the diet groups may be due to the presence phytochemicals such as tannins and saponins as well as dietary fibre that have been reported to exhibit hypoglycaemic effect [35]. Our finding also corroborates the work of Post et al. [29] who reported decrease in fasting blood glucose following high fibre diet. The result suggests that all the plants used in this study have good blood glucose lowering effect.
Decreased blood sodium and potassium concentration observed in all the G. latifolium levels of diet in contrast to the other plant diets has suggested its potent anti-diabetic activity. In diabetic conditions, the increased excretion of electrolytes and metabolites from the kidney alters the normal body homeostasis [36].
Mean body weights of the animals fed G. sylvestre diets was significantly increased compared to the other plants. This could be due to its ability to stimulate appetite in contrast to the other plant diets. Tanko et al [36] reported increase in mean body weights of experimental rats due to increase food intake.
5. Conclusion
All the plant products showed significant antihyperglycaemic effects. This may have been contributed by the fibre and mineral contents of the plants. Further research is needed to extract as well as characterize the bioactive ingredients of this plant for possible new drug formulation.
Acknowledgement
The authors declare that there was no external funding and conflict of interest does not exist.
References
- American Diabetes Association. Diagnosis and Classification of Diabetes Mellitus. Diabetes Care 2011, 34 (Suppl 1): S62–S69.
- Asif M. The prevention and control the type-2 diabetes by changing lifestyle and dietary pattern. J Edu Health Prom 2014, 3: 1.
- Jack L, Jr, Boseman L, Vinicor F. Aging Americans and diabetes. A public health and clinical response. Geriatrics 2004, 59 (4): 14-17.
- Lovejoy JC. The influence of dietary fat on insulin resistance. Curr Diab Rep 2002, 2 (5): 435-440.
- Giugliano D, Esposito K. Mediterranean diet and metabolic diseases. Curr Opin Lipidol 2008, 19: 63–68.
- Martinez-Gonzalez MA, de la Fuente-Arrillaga C, Nunez-Cordoba JM, Basterra-Gortari FJ, Beunza JJ, Vazquez Z, et al. Adherence to Mediterranean diet and risk of developing diabetes: Prospective cohort study. BMJ 2008, 336: 1348–1351.
- Willi C, Bodenmann P, Ghali WA, Faris PD, Cornuz J. Active smoking and the risk of type 2 diabetes: a systematic review and meta-analysis. JAMA 2007, (22): 2654-2664.
- Boffetta P, Mclerran D, Chan Y, Manami I, Sinha R, Gupta PC, et al. Body mass index and diabetes mellitus in Asia. A cross sectional pooled analysis of 900,000 individuals in the Asia cohort consortium 2011.
- Schröder H. Protective mechanisms of the Mediterranean diet in obesity and type 2 diabetes. J Nutr Biochem 2007, 18: 149-160.
- Lipi D, Eshani B, Utpal R, Runu C. Role of nutraceuticals in human health. J Food SciTech 2012, 49 (2): 173–183.
- Pandey M, Verma RK, Saraf SA. Nutraceuticals: new era of medicine and health. Asian J Pharm Clin Res 2010, 3: 11–15.
- AOAC. Official Methods of Analysis. 13th Edn., Association of Official Analytical Chemists, USA, 1990, 233-234.
- Pearson D.. The chemical Analysis of Foods. 7th Edn; Churchill Livingstone, London, 1976.
- Price ML, Butler LG. Rapid visual estimation and spectrophotometric determination of tannin content of sorghum grain. J Agric Food Chem 1977, 25 (6): 1268-1273.
- Thompson DB, Erdman JW Jr. Phytic acid determination in soybeans. J Food Sci 1982, 47: 513.
- Ukpabi UJ, Ejidoh JI. Effect of Deep Oil Frying on Oxalates Contents and Degree of Itching of Cocoyam. In: Experimental Procedures for Food and Water Analysis, Odo, F. O. and C. N Istiwu (Eds.). Computer Edge Publishers, London, 1989, 84-88.
- Agrawal PK, Jain DC, Gupta RK, Thakur RS. Carbon-13 NMR spectroscopy of steroidal sapogenins and steroidal saponins. Phytochemistry 1989, 24, 2479–2496.
- Kakade ML, Rackis JJ, Mcghee JE, Puski G. Determination of trypsin inhibitor activity of soya products. Cereal Chem 1974, 51: 376.
- James CJ. The Analytical Chemistry of Foods. Chapman and Hall Press, New York, 1989, 86.
- Trinder P. Determination of glucose in blood using glucose oxidase with an alternative oxygen acceptor. Ann Clin Biochem 1969, 6: 24-27.
- Fossati P, Lorenzo P. Serum Triglycerides determined colorimetrically with an enzyme that produces hydrogen-peroxide. Clin Chem 1982, 28: 2077–2080.
- Tietz NW. Specimen Collection and Processing; Sources of Biological Variation. Textbook of Clinical Chemistry, 2nd Edition, W. B. Saunders, Philadelphia, PA, 1984.
- Friedewald WT, Levy RI, Fredrickson DS. Estimation of the concentration of low-density lipoprotein cholesterol in plasma, without the use of preparative centrifuge. Clin Chem 1972, 18: 499–502.
- Terri AE, Sesin PG. Am J Clin Path 1958, 29: 86.
- Maruna RFL. Determination of serum sodium by the magnesium uranyl acetate. Clin Chem Acta 1958, 2: 581-585.
- Henry RJ, Cannon DC, Winkleman JW. Clinical Chemistry Principles and Technics, 2nd Edition, Harper and Row, 1974.
- Usunobun U, Okolie NP, Anyanwu OG, Adegbegi AJ, Egharevba ME. Phytochemical screening and proximate composition of Annoma muricata leave. EJBPSP 2015, 2 (1): 18-28.
- Weickert MO, Mohlig M, Koebnick C, Holst JJ, Namsolleck P, Ristow M, Osterhoff M, Rochlitz H, Rudovich N, Spranger J, Pfeiffer AF. Impact of cereal fibre on glucose–regulating factors. Diabetologia 2005, 48: 2343–2353.
- Post RE, Mainous AG, King DE, Simpson KN. Dietary fiber for the treatment of Type 2 Diabetes Mellitus. A meta-Analysis. J Am Board Fam Med 2012, 25 (1): 16-23.
- Ozcan M. Mineral Contents of some Plants used as condiments in Turkey. Food Chem 2003, 84: 437-440.
- Ha SK. Dietary Salt Intake and Hypertension. Electrolyte Blood Press 2014, 12 (1): 7-18.
- Takeda E, Yamamoto H, Yamanaka-Okumura H, Taketani Y. Dietary phosphorus in bone health and quality of life. Nutr Rev 2012, 70: 311-321.
- Akwaowo EU, Ndon BA, Etuk EU. Minerals and antinutrients in fluted pumpkin (Telfairia occidentalis Hook f.). Food Chem 2000, 70: 235-240.
- Ndlovu J, Afolayan AJ. Nutritional Analysis of the South African Wild Vegetable Corchorus olitorius L. A JPS 2008, 7: 615-618.
- Elliot M, Chithan K, Theoharis CT. The effects of plant flavanoids on mammalian cells: Implications for inflammation, heart disease and cancer. Pharmacol Rev 2000, 52: 673-751.
- Tanko Y, Sada NH, Mohammed KA, Jimoh, MY, Mohammed A. Effect of ethanolic extract of Caralluma daizielii on serum electrolytes levels on fructose-induced diabetes in Wistar rats. Ann Biol Res 2013, 4: 157-161.


