Soil Information System by Using Landsat TM and ASTER Images - Larrache - Morocco
Ibrahim W.1, Alessandro V.2
1Waad Ibrahim, German Archeological Institute- Friedrich Hinkel Research Center, Podbielski Allee, Berlin, Germany
2Valeria Alessandro, Geomatic and Natural Resource Department, (IAO) Agronomic Institute for Overseas, Florence, Italy
Email address

(Ibrahim W.)

(Alessandro V.)
Citation
Ibrahim W., Alessandro V. Soil Information System by Using Landsat TM and ASTER Images - Larrache - Morocco. American Journal of Agricultural Science. Vol. 3, No. 1, 2016, pp. 1-10.
Abstract
A reliable management policy should start from a deep knowledge of the available resources. Soil is one of the important natural nonrenewable sources which has vital functions medium for all other organisms. Therefore, Availability of detailed soil properties in a digital format can help better management with better allocation of crops and the needed fertilizers to be used on each crop. Furthermore, soil digital information will facilitate sustainable Land use where crops distribution take place in accordance with soil fertility which in turn saves money, efforts, and time during production cycle. Many tools are available, Remote Sensing RS and Geographic Information System GIS are one of the important tools used in producing digital spatial soil information supported by intensive field work. Landsat TM and ASTER images have been interpreted to delineate land unit base map which has been used later in field work. Each land unit included at least one soil profile, 317 soil profiles have been achieved during field survey (horizons were described, photographed, and sample were collected). Land units have been modified in relation to field observations including morphology and vegetation type. As a result, a detailed digital soil map has been produced for the study area (Larache- Morocco) with detailed database concerning chemical and physical properties. This database will be the corner stone of further important spatial analysis including suitability for rainfed crops, for irrigation, for forest development, and capability analysis.
Keywords
Larache, Morocco, Soil Digital Mapping, Remote Sensing, GIS, Land Management
1. Introduction
1.1. Background
Soil is a three dimensional body with properties that reflect the impact of climate, vegetation, fauna, man and topography on soil's parent material over a variable time span. The nature and relative importance of each of these five `soil forming factors' vary in time and in space. They show in their `soil profile' signs of differentiation or alteration of the soil material incurred in a process of soil formation or `pedogenesis' (FAO, 2001- Lecture notes on the major soils of the world).
Soil evaluation is the corner stone of any future land development and management, due to the fact of being the connecting agent of all other activities including agriculture, urban, infrastructure, and irrigation development (FAO, 1976, 1984).
The first step to evaluate Soil is to collect spatial information in the study area through
intensive field work including profile description, sampling, and later soil sample analysis (FAO, 1990, 1998). The first task to make these principles operative is to understand which factors define its characteristics and influence its evolution plus understanding the nature, properties, dynamics and functions of the soil as part of landscapes and ecosystems (Sys I., Van Ranst E., and Debaveye J. 1991), Furthermore, The classification of soils is based on soil properties defined in terms of diagnostic horizons, diagnostic properties and diagnostic materials, which to the greatest extent possible should be measurable and observable in the field (World Reference Base, 2015).
A basic requirement is the availability of reliable information concerning soil morphology and other characteristics obtained through examination and description of soil in the field (Zonneveld, I. S. 1972). It is important that soil description be done thoroughly; it serves as the basis for soil classification and site evaluation as well as interpretations on the genesis and environmental functions of the soil (FAO, 1976 and 1979 and Christian Omuto et. al, 2013).
1.2. Research Objectives
The general aim of this work is to implement land planning approach creating a technical instrument to assist decision-makers (politicians or technicians) in the definition of the land planning and management policy. This is physically realized building up a Geographic Information System (GIS) able to assess land performance when used for specific support (defined as "land evaluation"). Furthermore, the specific final objective of this study is to build a digital soil information system that can serve other spatial analysis like land use land cover change, suitability mapping for different purposes, and capability mapping; through the use of remote sensing (satellite image) and Geographic Information System (GIS) which can suitably visualize all results in clear maps.
1.3. Methodology
(Christian Omuto, et. al, 2013) defined Soil mapping as "is the term often used to describe the process of understanding and predicting the spatial distribution of soils, and the process that involves collecting field observations (including recording soil profile descriptions), analysing soil properties in the laboratory, describing landscape characteristics, and, ultimately, producing soil maps"
A suitable framework has been set up to organize the work according to a holistic approach including FAO principles of soil classification. The work was divided in three distinct phases: the preliminary processing, the field work in Morocco and the final processing (Ongaro L, 1998).
The first step was the visual interpretation of satellite images and aerial photographs assisted by computer (with ancillary data, such as topographic, geological maps, and bibliographic information) and resulted with a preliminary land unit map. Remote sensed data are basic tools to analyze spatially the land, starting from its synthesis though identifying homogeneous land areas (Van Zuidam R. A. 1986).
This preliminary interpretation constituted the basis for the next data collection campaign. Filed work was carried out in the province of Larache in April 2002, getting several quantitative and qualitative information concerning land and soils. In the third step, developed after the fieldwork, GIS were set up with data and information and the final Soil map and its legend were defined and the data stored and analyzed. This framework and the phases of the research are shown in figure 1.
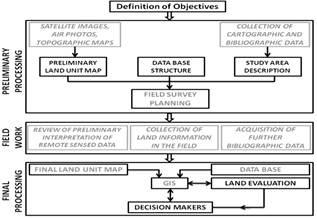
Figure 1. Flowchart of the research towards digital soil information.
1.3.1. Research Materials
Available topographic maps at scale1: 50,000 (Asilah, Larache, Lalla Mimouna, Arba Ayacha, El Ksar el Kebir, and Arbaoua) and 1: 100,000 (Larache, El Ksar el Kebir, Souk El Arba du Rharb, and Ouezzane) printed by Cartographic Division of Rabat, were used for identification of the boundary of the study area. In addition, other type of maps were available including the geological map at scale 1: 50,000 printed by "Ministére de l’Energie et des Mines" (1987 and 1997) and the forest map at scale 1: 100,000 printed by "Ministére chargé des Eaux et Forets" (2000). Furthermore, Satellite images and aerial photographs were used as remote sensing data coming from three types of satellite images (Table 1) including Landsat 5, Landsat 7 and ASTER. The main differences between Landsat 5 and Landsat 7 are the ETM+ instrument, with an added panchromatic band, and the thermal IR channel with 120m spatial resolution for Landsat 5 and 60m for Landsat 7; ASTER (Advanced Space borne Thermal Emission and Reflection Radiometer) is an imaging instrument that is flying on Terra, a satellite launched in December 1999 with 14 spectral bands; in this study, ASTER satellite images were more useful because of the best spectral resolution when compared to images of Landsat TM. The properties and differences of these satellite images can be seen in Table 2.
Table 1. Remote sensing data used in the Research.
| Aerial Photos |
| Type | Date of acquisition | Scale |
| Panchromatic | October 1992 | Approx. 1/40000 |
| Satellite Images |
| Satellite Sensor | Date of acquisition | Bands available |
| Landsat- 5 TM | 14.03.1985 | 1, 2, 3, 4, 5, 6 and 7 |
| Landsat- 7 ETM+ | 15.03.2000 | 1, 2, 3, 4, 5, 6, 7 and Pan |
| Terra ASTER | 15.06.2001 | 1, 2, 3, 4, 5, 6, 7, 8, 9, 10, 11, 12, 13, 14 |
Table 2. The spectral characteristics of Landsat 7 - ETM+ and Aster.
| Landsat 7 ETM+ Images | ASTER images |
| Band | Wavelength | Resolution | Subsystem | Band | Wavelength | Resolution |
| 1 | 0.45-0.52 μm | 30 m | VNIR (Visible and Near InfraRed) | 1 | 0.52-0.60 μm | 15 m |
| 2 | 0.52-0.60 μm | 2 | 0.63-0.69 μm |
| 3 | 0.63-0.69 μm | 3 | 0.76-0.86 μm |
| 4 | 0.76-0.90 μm | SWIR (ShortWave InfraRed) | 4 | 1.60-1.70 μm | 30 m |
| 5 | 1.55-1.75 μm | 5 | 2.145-2.185 μm |
| 6 | 10.4-12.5 μm | 60 m | 6 | 2.185-2.225 μm |
| 7 | 2.08-2.35 μm | 30 m | 7 | 2.235-2.285 μm |
| 8 | 0.50-0.90 μm | 15 m | 8 | 2.295-2.365 μm |
| | | | 9 | 2.360-2.430 μm |
| | | | TIR (Thermal InfraRed) | 10 | 8.125-8.475 μm | 90 m |
| | | | 11 | 8.475-8.825 μm |
| | | | 12 | 8.925-9.275 μm |
| | | | 13 | 10.25-10.95 μm |
| | | | 14 | 10.95-11.65 μm |
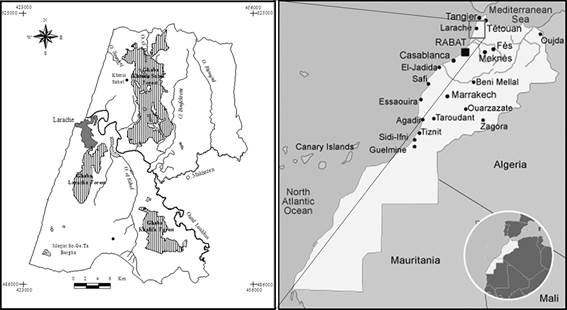
Figure 2. Study area Location (Right) Morocco, (Lift) Larache area.
1.3.2. Description of Study Area
The study area under investigation (Larache Province) is located in the north-western Morocco, between  - 20" to
  - 10" East, and it is part of the Atlantic pediment of western Rif (figure 2). From the administrative point of view, it is included in the Province of Larache, in the Tangier-Tetouan Region, and in particular the boundary of the study area corresponds to the municipalities of: Larache M., Khemis Sahel, Rissana Chamalia, Rissana Janoubia, El Aouahmbra and Zouada. It covers a surface area of around 750
  . The region is characterized by a Mediterranean sub-humid climate with two main seasons: the first one, humid and fresh, is present from October to April, when 85% of total precipitation falls and the average temperature is about 17 degree C. The second one, dry and warm, from May to October, has an average temperature of about 24 degree. Larache has an average yearly precipitation of 695.5 mm.
The study area includes part of the Oued Loukkos watershed, characterized by the presence of some tributaries, mainly coming from the Rif and distributed overall along the right side; along a North-South or East-West direction. The Oued Loukkos has a low slope and, in the section closest to the sea, the bed is beneath the sea level causing frequent overflows; in order to rule the regime of the Oued Loukkos, the dam on Oued el Makhazine was built (1977).
2. Results
2.1. Results of Preliminary Processing and Field Work
Using the cadastral forestry maps, produced by Ministére chargé des Eaux et Forets (2000), the geographic boundaries of the study area were drawn. The main step was the photo-interpretation of the remote sensing data (black and white aerial photos and satellite image) which was carried out according to IAO framework.
During the photo-interpretation, fourteen different types of landforms (sub-flat hill with rounded crests, sloping rolling area, elongated ridges, colluvial-alluvial deposits, fluvial terraces, alluvial-colluvial deposits, flood plain, river bed, low hill, flat to undulating area, sloping area with small closed depressions, dissected slopes, rolling area, closed depression) were defined, as seen in figure 3 and 4, the codes information can be seen in table 3.
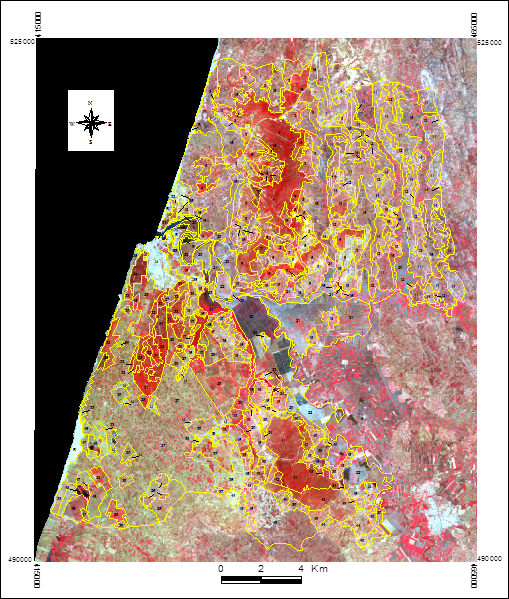
Figure 3. Land Unit.
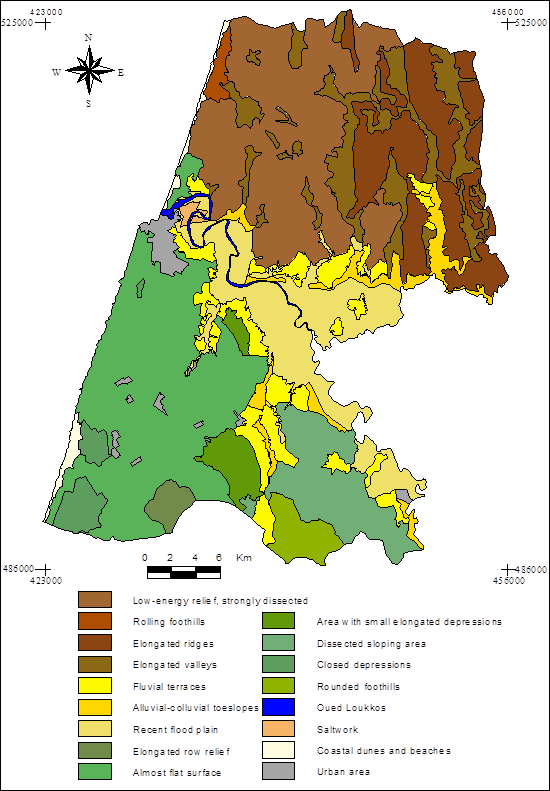
Figure 4. Land Forms.
2.2. Land System Mapping
Three land systems were identified mainly due to topographic characteristics (map 3) which include: Northern Rolling Reliefs, Oued Loukkos Valley and Southern Undulating Reliefs. In a second level land systems were divided into 14 landforms using remote sensing, photo interpretation and field survey and due to the final working scale (1: 100,000). The relative high number of landforms is a consequence of a quite not homogeneous landscape especially in the eastern part of the study area.
Table 3. Land Unit Codes used in Preliminary process.
| Land System | Bedrock | Land Form | Land Unit | Land Use Land Cover |
| NORTHEN ROLLING RELIEFS | Semi consolidated sandy deposits over interbedded sandstones and marls | Low-energy relief, strongly dissected | 1 | Rainfed fallow agriculture |
| 2 | Irrigated intensive agriculture -tree crops |
| 3 | Rural village |
| 4 | Open to closed forest with a second layer of closed mixed mediterranean shrubs |
| 5 | Very open forest with a second layer of sparse dwarf shrubs |
| 6 | Forest plantation |
| 7 | Forest plantation |
| 8 | Open dwarf scrub with extensive grazing |
| 9 | Sparse scrub |
| Inter-bedded sandstones and marls | Rolling foothills | 10 | Rainfed agriculture |
| Elongated ridges | 11 | Rainfed fallow agriculture |
| 12 | Rural village |
| 13 | Forest plantation |
| 14 | Open to close dwarf scrub with extensive grazing |
| Elongated valleys | 15 | Rainfed agriculture |
| OUED LOUKKOS VALLEY | Prevalently fine unconsolidated deposits | Fluvial terraces | 16 | Rainfed fallow agriculture and extensive grazing |
| 17 | Irrigated intensive agriculture -tree crops |
| 18 | Rural village |
| 19 | Open dwarf scrub with extensive grazing |
| Alluvial-colluvial toe slopes | 20 | Rainfed fallow agriculture, somewhere irrigated |
| Recent flood plain | 21 | Rainfed agriculture, somewhere irrigated |
| 22 | Irrigated ricefields and rainfed extensive agriculture on large fields |
| 23 | Marsh with brackish water and hydromorphic vegetation |
| 24 | Marsh with permanent superficial water and hydromorphic Veg- |
| SOUTHERN UNDULATING RELIEFS | Medium to coarse unconsolidated deposits | Elongated low relief | 25 | Rainfed fallow agriculture, somewhere irrigated |
| 26 | Rural village.. |
| Almost flat surface | 27 | Irrigated agriculture |
| 28 | Irrigated intensive agriculture -tree crops |
| 29 | Irrigated intensive agriculture -agro-industry |
| 30 | Rural village |
| 31 | Closed forest with open to closed fern undergrowth |
| 32 | Open forest with closed fern undergrowth |
| 33 | Forest plantation |
| 34 | Forest plantation |
| 35 | Open fern |
| Area with small elongated depressions | 36 | Rainfed fallow agriculture |
| 37 | Forest plantation |
| 38 | Sparse scrub |
| Coarse unconsolidated deposits | Dissected sloping area | 39 | Rainfed fallow agriculture and extensive grazing |
| 40 | Rural village |
| 41 | Closed forest with a second layer of open mixed shrubs or forbs |
| 42 | Open forest with a second layer of closed shrubs |
| 43 | Forest plantation |
| 44 | Open dwarf scrub with extensive grazing |
| Calcarenites | Closed depression | 45 | Rainfed agriculture, somewhere irrigated |
| 46 | Irrigated intensive agriculture tree crops |
| 47 | Rural village |
| 48 | Marsh with permanent superficial water and hydromorphic vegetation |
| Marls | Rounded foothills | 49 | Rainfed agriculture |
| | | | L | Oued Loukkos |
| | | | B | Saltwork |
| | | | S | Coastal dunes and beaches |
| | | | U | Urban area |
2.3. Results of Final Processing
2.3.1. Soil Mapping
According to guidelines of F. A. O. (1990) and World Reference base for Soil Resources (F. A. O, 1998), the most representative points for soil profiles were detected. Data containing information about boundary, moisture status, colour, rock fragments, texture, consistency, penetrometer, CaCO3, roots, cutans, mottles, efflorescence, nodules, voids and biological features for each horizon were collected. In general all soil types are poor in organic matter according to Metson classification (1961) and Landon (1984). The final report contains soil map with ten groups of soil type (USA soil Taxonomy 1997) seen in figure 5, 6 and table 4.
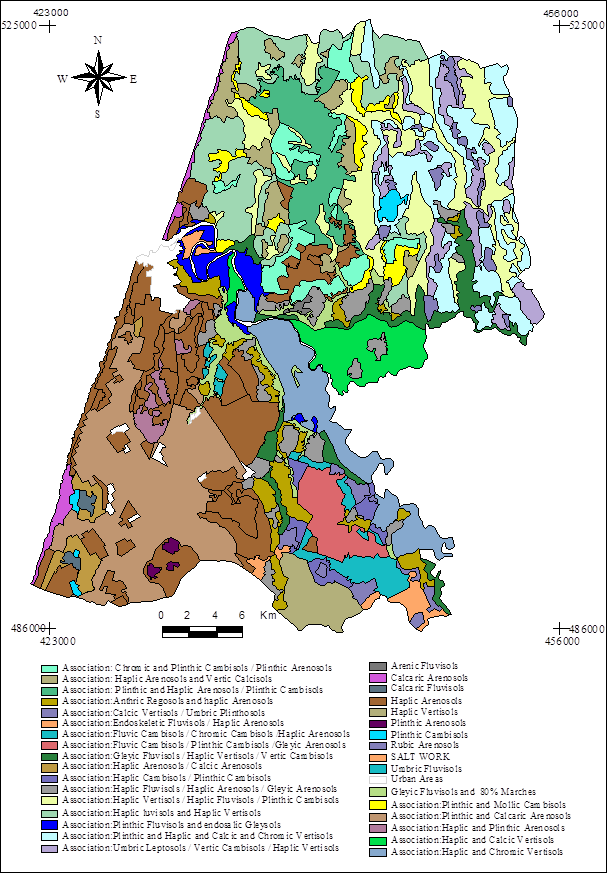
Figure 5. Detailed Soil Map of Larache – Morocco.
Table 4. Groups of soil type with spatial information.
| Soil classification | Soil classification code | Relevé number | Land unit |
| 1 | Cambisols fluvic | CMfv | 104,117 | 41, 43 |
| 1 | Cambisols plinthic | CMpl | 107, 111, 220, 301, 307, 402, 415, 422 | 15, 47, 39, 41, 13, 4, 8 |
| 1 | Cambisols vertic | CMvr | 206, 317 | 20, 8 |
| 1 | Cambisols chromic | CMcr | 205, 214 | 43, 6 |
| 1 | Cambisols haplic | CMha | 224 | 39 |
| 1 | Cambisols mollic | CMmo | 403 | 8 |
| 2 | Arenosols haplic | ARha | 105, 106, 115, 116, 119, 121, 122, 126, 127, 201, 203, 204, 208, 209, 210, 212, 216, 221, 302, 305, 308, 309, 318, 321, 405, 407, 408, 410, 411, 412, 416, 417, 418, 419, 421 | 45, 46, 43, 44, 9, 5, 7, 4, 2, 3, 16, 18, 27, 33, 31, 34, 32, 28, 35, 30, 25, 36, 37, 38 |
| 2 | Arenosols rubic | ARru | 215 | 40 |
| 2 | Arenosols gleyic | ARgl | 213, 315 | 41, 18 |
| 2 | Arenosols calcaric | ARca | 310, 414 | 93, 27 |
| 2 | Arenosols plinthic | ARpl | 101, 217, 304, 404, 406, 413 | 4, 6, 26, 27, 31 |
| 3 | Vertisols haplic | VRha | 102, 112, 124, 207, 306, 314, 316, 319, 320, 323, 423 | 20, 15, 11, 14, 22, 21, 1, 49, 10 |
| 3 | Vertisols calcic | VRca | 109, 401, 420 | 12, 11, 21 |
| 3 | Vertisols chromic | VRcr | 125, 202 | 11, 22 |
| 3 | Vertisols plinthic | VRpl | 103 | 11 |
| 4 | Fluvisols haplic | FLha | 113, 118 | 15, 18 |
| 4 | Fluvisols plinthic | FLpl | 218 | 23 |
| 4 | Fluvisols umbric | FLum | 120 | 16 |
| 4 | Fluvisols gleyic | FLgl | 211, 223 | 20, 24 |
| 4 | Fluvisols arenic | FLar | 222 | 19 |
| 4 | Fluvisols calcaric | FLca | 311 | 48 |
| 4 | Fluvisols endoskeletic | FLen | 312 | 44 |
| 5 | Luvisols haplic | LUha | 108 | 1 |
| 6 | Calcisols vertic | CLvr | 303 | 3 |
| 7 | Gleysols endosalic | GLen | 219 | 23 |
| 8 | Leptosols umbric | LPum | 110 | 14 |
| 9 | Plinthisols umbric | PLum | 313 | 12 |
| 10 | Regosols anthric | RGta | 114 | 1 |
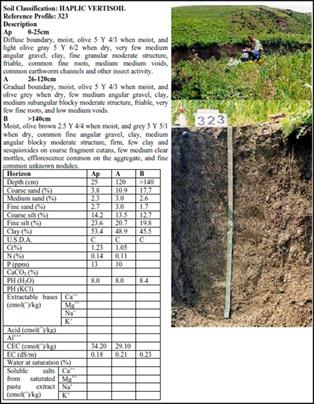
Figure 6. Soil Profile, Field Description.
According to soil lab analysis, two main groups of Soil Texture can be distinguished: A) Vertisols has at least one soil horizon with high clay content, high water holding capacity with poor drainage due to clay horizon; and B) Arenosols with a dominant sandy texture, which is considering poorly fertile due to easily leaching of nutrient and low water holding capacity.
2.3.2. Chemical and Physical Characteristics
a) Acidity of Soil pH:
Average, minimum, and maximum of analyzed soil pH are shown in Table 5; No significant acidity variation, according to variation in soil depth, was noticed.
Table 5. The minimum, maximum soil pH for all soils in the study area and average for soil surface layer.
| Soil Type | Min | Max | Average for Soil Surface |
| Arenosols | 4.7 | 8.7 | 6.5 |
| Calcisols | 8.2 | 8.4 | 8.3 |
| Cambisols | 4.9 | 8.5 | 6.7 |
| Fluvisols | 4.7 | 8.3 | 6.5 |
| Gleysols | 8.3 | 8.4 | 8.35 |
| Leptosols | 5.5 | 6 | 5.75 |
| Luvisols | 7.7 | 7.8 | 7.75 |
| Plintosols | 7.7 | 8.5 | 8.1 |
| Regosols | 5.2 | 6.1 | 5.65 |
| Vertisols | 6.0 | 8.6 | 7.3 |
b) ORGANIC MATTER
The organic matter expressed by organic carbon is (in general) very low, due to lower application of organic material to soil and high decomposition rate because of high rainfall in winter season and high temperature in summer as shown in Table 6. Organic carbon was measured for the first two horizons and, in some exceptional case, also for the third horizon; the higher values were mainly found in soil surfaces. Higher organic matter contents were noted in cultivated natural forest, and very low organic matter in non-cultivated land.
Table 6. The minimum, maximum soil organic matter for all soils and average for soil surface layer.
| Soil Type | Min | Max | Average for Soil Surface |
| Arenosols | 0.10 | 5.9 | 1.3 |
| Calcisols | 0.7 | 1.5 | 1.5 |
| Cambisols | 0.15 | 14.9 | 2.58 |
| Fluvisols | 0.21 | 7.31 | 1.84 |
| Gleysols | 1.5 | 2.1 | 2.1 |
| Leptosols | 1.5 | 4.2 | 4.2 |
| Luvisols | 0.8 | 1.2 | 1.2 |
| Plintosols | 1.2 | 1.8 | 1.2 |
| Regosols | 0.6 | 0.8 | 0.8 |
| Vertisols | 0.9 | 2.4 | 1.9 |
c) NITROGEN
Nitrogen percentage in the soil ranges from 0.02% to 0.3% (low to medium), rarely exceeding 0.25%. Most soils has in majority smaller nitrogen concentration in the surface horizon less than 0.1%. Nitrogen concentration decreases with soil depth for all kind of soils. It was noticed that nitrogen concentration in the natural vegetation is higher than in the cultivated ones. Most of soils of study area lower N values in acidic soil than basic soils; this could be partially explained by the low microbiological activity in acid soils. The nitrogen average percentage for the soil surface was as follow: Arenosols (0.06), Calcisols (0.12), Cambisols (0.11), Fluvisols (0.10), Gleysols (0.16), Leptosols (0.21), Luvisols (0.07), Plintosols (0.07), Regosols (0.06), and Vertisols (0.12).
d) CARBON/NITROGEN (C/N) RATIO
Carbon Nitrogen ratio is highly related with the concentration of nitrogen and Carbon in the soil. Nitrogen Carbon ratio has the same trend of nitrogen and carbon in the soil. It decreases with the increasing of soil depth for all kind of soils. The average C/N ratio of soil surface horizons was Arenosols (12.4), Calcisols (7.5), Cambisols (12.8), Fluvisols (10.1), Gleysols (7.8), Leptosols (11.8), Luvisols (9.6), Plintosols (10.3), Regosols (8.0), and Vertisols (9.5).
e) PHOSPHOROUS
Phosphorous concentration in the soil is generally considered very low if inferior than 10 ppm; in Larache study area, only 13 soil Relevées out of 46 Relevées carried out in Arenosols have phosphorus concentration higher than 10 ppm. High phosphorus concentration was found in cultivated soils due to high input of chemical fertilizers. From the laboratory analysis, it was noticed that the highest phosphorus concentration was present in the soil belonging to villages’ environment reaching the value of 53 ppm. This situation can be caused by natural and chemical fertilizer addition to soil. For some soils Phosphorus concentration increases according to soil depths, due to high clay content retaining phosphorous at the soil surface. Whereas other soils, such as Arenosols and Fluvisols, does not show such a strong variation, due to low clay content of the surface and dominant of sand texture for these soils.
f) CALCIUM CARBONATE (CaCO3)
Most of soils in the study area have low values in calcium carbonate. For example in the Vertisols only three Relevées out of 18 have calcic horizon with the highest percentage of 22.2%. Arenosols show only two Relevées out of 46 with calcic horizon (45%) while Calcisols has only one (57.8%). So we can conclude that the soils of the study area are, in general, non-calcareous with a very low effect on soil acidity (in general pH <7).
g) SALINITY
In general, the average salinity in study area is very low (less than 0.2 dS/m) with a maximum value of 1.15 dS/m. Lower soil salinity can be caused by the soil texture, mainly sandy, lead to good drainage properties of soils.
3. Conclusion
Soil pH values range widely from one soil to another, and also vary among relevées of the same soil. Soil fertility (phosphorous, organic matter, nitrogen percentage) of Larache is poor, and farmer must add more fertilizer to get an optimum agriculture production. Phosphorus concentration decreases with increasing of soil depth in relation to soil types. Most of phosphorous applied to the soil is available to crop, due to low content of calcium carbonate. Furthermore, the study area is dominated by sandy soil. Larach soils are, in general, non-calcareous soil affecting positively the micro nutrient and phosphorus availability when added to cultivated soil. According to soil salinity we can consider the study area as a good soil for agriculture especially for highly sensitive crops to salinity. Different spatial analysis (FAO Soil Suitability for rainfed crops, for forestry, for irrigation techniques, FAO Soil Capability of soil, and land use land cover change) were done depending of this soil information system.
Acknowledgements
Authors wish to thank the Italian Ministry of foreign affairs represented by the Institute of overseas Agriculture research (I. A. O) for supporting the Master research done in Morocco-Larache
References
- Adil S. (1996) – Les formations littorales Quaternaires de Larache: sedimentologie, paleoenvironnement, datation radiochimique et probleme d’amenagement.Thèse, Université Mohammed V Faculté des sciences, Rabat.
- Bernetti G. (1995) - Selvicoltura speciale. UTET, Torino, p. 326.
- De Martonne E. (1927) - Regions of interior basin drainage. Geographical Review 17:397-414.
- F. A. O (1976) - A framework for land evaluation. Soils Bulletin n.32. F. A. O, Roma.
- F. A. O (1979) - Soil survey investigation for irrigation. Soils bulletin n.42, F. A. O Rome.
- F. A. O (1983) - Guidelines: land evaluation for rainfed agriculture. Soils bulletin 52, F. A. O Rome, pp.237.
- F. A. O (2013) - State of the Art Report of the Global and Regional Soil Information: Where are we? Where to Go? Global soil Partnership, Technical report, Rome.
- F. A. O (1984) - Land Evaluation for forestry. Forestry Paper 48,F. A. O., Rome.
- F. A. O (1990) - Guidelines for soil description. F. A. O Rome, pp. 69.
- F. A. O (1998) - World reference base for soil resources. F. A. O Rome, pp. 88.
- F. A. O (2001) - http//www.F. A. O.org/landandwater/ag/at…/awria/main_html/description/htm
- Landon J. R. (1984) - Booker tropical soil manual. Booker Agricultural International Limited, London, pp. 450.
- McDonald R.C., Isbell R. F., Speight J.G., Walker J., and Hopkins M.S. (1998) - Australian soil and land survey. C.S.I.R.O. publishing, pp. 190.
- Metson A. J. (1961) – Methods of chemical analysis for soil survey samples. New Zeland Dept. Sci. Ind. Res. Soil Bur. Bull. 12, Govt. printed, New Zealand.
- Ongaro L. (1998) - Land Unit Mapping for Land Evaluation. Istituto Agronomico per l’Oltremare. Relazioni e monografie agrarie tropicali e subtropicali-Nuova serie, 115, 50 pp.
- Sys I., Van Ranst E., and Debaveye J. (1991) – Land evaluation, part II. Methods in land evaluation. General administration for development cooperation, Brussels, pp. 247.
- United States Department of Agriculture (1997) - Key to soil taxonomy. Soil survey Staff, 7th edition, Blacksburg, VA, Pocahontas Press.
- World Reference Base for Soil Information (2014/ Update 2015)-International Soil Classification System for naming soils and creating legends for soil maps- World Soil Resources Reports, 106.
- Van Zuidam R. A. (1986) - Aerial photo-interpretation in terrain analysis and geomorphologic mapping. Smits Publishers, the Netherlands, pp. 442.
- Zonneveld, I.S. (1972) - Land evaluation and landscape science. ITC textbook of photo interpretation, v.VII, ITC, Enschede.


