| 1. | ||
| 2. | ||
| 2.1. | ||
| 2.2. | ||
| 3. | ||
| 4. | ||
Historical Sensitivity to Temperature and Precipitation for Irrigated and Non-irrigated Cotton Yields in the Mississippi Delta
Toby Ryan FitzSimons*, Derrick Oosterhuis
Department of Crop, Soil and Environmental Sciences, University of Arkansas, Fayetteville, AR, USA
Email address
 (T. R. FitzSimons)
 Citation
Toby Ryan FitzSimons, Derrick Oosterhuis. Historical Sensitivity to Temperature and Precipitation for Irrigated and Non-irrigated Cotton Yields in the Mississippi Delta. American Journal of Agricultural Science. Vol. 3, No. 1, 2016, pp. 11-20.
Abstract
An investigation of cotton yield between irrigated and non-irrigated fields in Arkansas from 1980 to the present was initiated to determine if large regional effects in yield could be attributed to heat or precipitation stress. Temperature and precipitation data were acquired from weather stations centrally located in three agricultural districts of eastern Arkansas, encompassing most of the cotton growing regions of the state. Cotton yields were obtained from the United States Department of Agriculture’s (USDA), and the National Agricultural Statistics Service (NASS) for both irrigated and non-irrigated fields within the state. Yield relationships were quantified between the months of June, July, and August for maximum and minimal temperature influence on yield, precipitation, as well as decadal trends of historical yield. Analyses determined that Arkansas irrigated fields were most influenced by warmer July temperatures decreasing 47.01 kg/ha-1/°C with increasing maximal and decreasing -51.61 kg/ha-1/°C as minimum temperatures increased. Likewise, non-irrigated yields decreased 56.92 kg/ha-1/°C and 71.94 kg/ha-1/°C as July maximum and minimum temperatures increase. Historically, irrigated cotton yields have averaged near 25% greater than non-irrigated fields since the early 1980’s. Effects of precipitation were limited compared to the influence of temperature. Only non-irrigated yields indicated significant increases for the month of August, increasing by 19.76 kg/ha-1/cm-1. The overall results indicate that irrigated and non-irrigated yields historically parallel, therefore we suggest that overall yield gains are the result of better yielding cultivars and management practices. Furthermore, the results indicated that modern cotton cultivars appear to be just as intolerant to increasing temperatures and mild drought stress as cultivars planted in the past.
Keywords
Cotton, Irrigated, Non-irrigated, Historical, Reproduction, Heat stress, Drought, Mississippi Delta
1. Introduction
Cotton (Gossypium hirsutum L.) producers often establish long-term goals for their fields by determining if irrigation is a profitable expenditure given its installation and startup costs. One of the principal factors taken into consideration is whether the climatic conditions necessitate irrigation; Temperature and precipitation being the two biggest climatic factors influencing these decisions. In Arkansas, the Mississippi River Delta region is composed of a shallow water table, deep alluvial soils, flat topography, and large annual rainfall that can exceed 1.5 m a year (Bengtson et al., 1995; Snipes and Nichols, 2005). This contributes to the Mississippi River Valley as one of the most productive agricultural regions in the United States. However, despite large precipitation resources, Arkansas is the most heavily irrigated state in the region (Maupin and Barber, 2005). A majority of the irrigation in the region is groundwater derived from the Mississippi River Valley Alluvial Aquifer that is in danger of depletion due to continued withdrawals. Currently only 43% of the aquifer withdrawal demand is sustainable, with more than 96% of the water extracted used for agriculture (Sullivan and Delp, 2007).
Many irrigation strategies rely upon daily maximum temperatures as an influencing factor for their applications (Jackson et al., 1981; Usman et al., 2010; O’Shaughnessy and Evett, 2010). Irrigation’s primary purpose to maximize yields is to relieve water stress effects that can reduce the number of bolls the plant can accommodate (Guinn, 1976; Pettigrew, 2004). However, irrigation has also been used to minimize the effects of high temperature by increasing transpiration rates, thus reducing the temperature of the plant relative to the air temperature (Burke and Upchurch, 1989; Wanjura and Mahan, 1994; Mahan et al., 1995). This need for cooler leaves relative to the ambient air temperature is due to cotton’s relative sensitivity to high temperature stress (Singh et al., 2007; Snider et al., 2009; Gür et al., 2010). Under greenhouse conditions, cotton develops optimally in air temperatures of 20 to 30°C (Reddy et al., 1991, 1992b). Field observations indicate an enzymatic optimal temperature range between 23.5 and 32°C (Burke et al., 1988). Yet, temperatures in the Mississippi River Valley routinely exceed these temperatures in the afternoons of the summer months, with maximal temperatures occasionally exceeding 38°C (Boykin et al., 1995).
The timing of these increased temperatures occur during the most sensitive of cotton development, reproduction (Reddy et al., 1992a; Snider et al., 2011b). The developing ovary and boll is highly susceptible to high temperatures within the first 14 days after anthesis with homeostatic disruptions leading to the developing boll’s abortion (Stewart 1986). Consequently, warmer temperatures have a negative impact of yield. Pettigrew (2008) noted that cotton exposed to a modest increase of 0.5 to 0.8°C over the duration of the growing season negatively impacted yield by as much as 10%. Work by Katani et al. (2005) noted that cultivars that were bred for greater thermo-tolerance did not have increased pollen germination rates or longer pollen tubes, suggesting that pollen tolerance may be the limiting factor in heat related reproductive success. This was acknowledged by Snider et al. (2011a) who noted that high temperature decreased growth rates of pollen tubes and negatively influenced reproductive success. Thus, higher temperatures during reproductive development is a significant negative impactor upon yield (ur Rahman et al., 2004; Pettigrew, 2008; Zinn et al., 2010).
To compensate for increased temperatures, growers plant as early as possible in the spring season. This adjustment can be a significant factor for yield response with later planting dates producing both less yield and lower micronaire values than cotton planted at earlier dates (Bilbro and Ray, 1973; Wrather et al., 2008). For effective stands, proper planting is heavily dependent upon soil temperature. In cotton, soil temperatures have long been recognized as 15.5°C (60 °F) for at least 10 days in the upper portion of the soil profile being the minimum accepted value (Gipson, 1986). At lower temperatures, rates of radicle tip death, and root cortex disintegration increase considerably (Christiansen, 1968), leading to radicle death and the condition often referred to as "nub root". Work from Wanjura et al. (1967) indicated that if soil temperatures decreased from 20 to 12°C, then the number of hours needed for seedling emergence increased from 100 to approximately 425 hours. McMichael and Burke (McMichael and Burke, 1994) demonstrated that increasing soil temperatures between 20°C and 32°C was ideal for root growth development and outside of these temperatures root length decreased to near zero. This coincides with previous work that in more northern sites of cotton production, including the Southern Missouri and Northern Arkansas counties, that temperatures in the upper soil must be 20°C or above for several days to account for a higher incidence of sporadic cooler weather (McQuigg, James et al., 1965). For areas of central Arkansas, the University of Arkansas Lon Mann Research Station has on average (1985-2014) a cotton planting date in the second week of May (Data not shown), which has been long known as the optimal time for planting within the region (Ballard and Simpson, 1925).
Since cotton requires a certain period of heat to produce a productive crop, the amount of accumulated heat units (HU) and developmental growth rates are closely associated. In the Mid-south regions of the United States these HU’s are calculated simply by the daily mean temperature minus the lower growth temperature threshold of the crop, and commonly referred to as a DD60 (Arnold, 1960; Baskerville and Emin, 2015):
![]() °C
°C
Silvertooth et al. (1991) reported that in Arizona climates where Pima cotton (Gossypium barbadense) is sown, HU requirements were dependent upon the varietal fruiting habit of the particular cultivar selected. For instance, full-season cotton cultivars needed on average 350 HU more than short season cultivars. The HU calculations based upon an adjustment of 30 and 12.8°C, as upper and lower temperature limits, which is not what the majority of cotton growers utilize. In Tifton, Georgia which is more representative of the Mississippi Delta region, first squaring averages after 550 HU is accumulated, or 38 days following planting, first flower occurs at 950 HU or about 60 days, and the first open boll corresponds to 2150 HU or a little more than 115 days based upon the DD60 (Ritchie et al., 2004).
Understanding that fruiting and final yield are firmly based upon temperature effects and subsequent irrigation strategies, this research was initiated to determine if historical yield response could be correlated with irrigation, temperature, and growth regions of the state. To our knowledge, no previous research exists of this type in the Mississippi Delta. Additionally, we wanted to investigate the response of yield to temperature during the months of reproductive development, to determine when yield would be most affected by heat stress. By identifying months of reproductive development when heat stress has the greatest impact, it may be possible to optimize irrigation to only those periods. Moreover, since the vast majority of cultivars planted today are genetically modified (Dill et al., 2008), we sought to examine if these newer cultivars were better tolerant of temperatures and precipitation stress than of decades past.
2. Methods
2.1. Data Acquisition
Cotton yields in lb/acre were collected from the United States Department of Agriculture’s (USDA) National Agricultural Statistics Service (NASS) for both irrigated and non-irrigated fields within the state of Arkansas and three Arkansas agricultural districts. The Northeast agricultural district was comprised of the following counties: Clay, Craighead, Greene, Independence, Jackson, Lawrence, Mississippi, Poinsett, Randolph, and White. The East Central agricultural district was comprised of the following counties: Arkansas, Crittenden, Cross, Lee, Lonoke, Monroe, Phillips, Prairie, Saint Francis, and Woodruff. The Southeast agricultural district was comprised of the following counties: Ashley, Chicot, Desha, Drew, Jefferson, and Lincoln. Yields were converted into conventional SI units of kg/ha-1, and all data analyses performed on the transformed datasets. Cotton yields were available from 1980 to 2009 for the East Central and Southeast Districts, from 1980 to 2012 for the Northeast district, and 1980 to 2014 for the state of Arkansas.
Daily maximum and minimum temperatures were collected from as centrally located a station as possible within each district. Data was collected from 1980 until 2014 from weather station daily reports collected by the National Oceanic and Atmospheric Administration. The Northeast district weather data came from the Jonesboro 2 (GHCND: USC0003373) weather station. Missing datasets were collected from the adjacent weather station located at the Jonesboro Municipal Airport (GHCND: USW00003953). East Central district weather data was acquired from the Marianna, AR weather station (GHCND: USC00034638), missing values were gathered from the Arkabutla Dam, MS weather station (GHCND: USC00220237). The Southeast district weather data was acquired from the Rohwer 2 NNE weather station (GHCND: USC00036253), missing values were input from the Dumas, AR weather station (GHCND: USC00032148).
2.2. Data Setup and Statistical Analysis
Taking the average days of development as a guide (Ritchie et al., 2004), and that cotton is sown on average in the 20th week in Marianna, AR averages for anthesis were calculated. The average date of squaring occurred on the 25th week of the year, and first flowering on the 28th week of the year. This places reproductive development firmly within the summer months of June, July, and August. For this study, only these months were investigated for analysis.
Due to yearly variations in yield, decadal periods were analyzed to investigate increasingly modern cultivars and their possible response to temperature and precipitation. Assumptions were made that producers provided proper management such as pesticides, nematicides, and herbicides during the growing season and not included as confounding factors. We also expected that growers would plant the optimal cultivar for the region for the time, thus making the maximal yields dependent upon the irrigation and temperature of that year. Factors analyzed included the district, irrigation type, time period, month, maximum and minimum temperatures, and precipitation. All regression analyses were performed in JMP 12.1 (SAS Institute, Cary, NC) at α = 0.05 level using the above cofactors.
3. Results and Discussion
Arkansas irrigation practices have changed significantly since 1980. Figure 1 indicates the hectares of irrigated and non-irrigated fields to the total hectares planted from 1980 to the current. It shows that irrigated fields have become the overwhelming dominant field type in Arkansas. Irrigated hectares surpassed non-irrigated hectares in the mid-1990’s and continue to dominate non-irrigated trends. In the past 5 years, total planted hectares have been declining. Flander et al. (2014) attributed this decline to market shifting from cotton to other crops in the region as prices for cotton decreased.
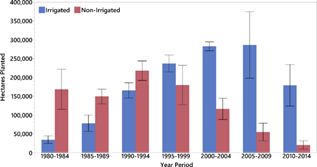
Figure 1. Irrigated and non-irrigated hectares of cotton planted in the state of Arkansas acquired from NASS and grouped into 5-year periods from 1980 to 2014. Error bars indicate the confidence interval at α = 0.05.
While Arkansas cotton productions has decreased, the disparity between irrigated and non-irrigated yields has remained steady over the years. The state and agricultural district breakdown for irrigated and non-irrigated yields from 1980-2010 (Figure 2) indicate that irrigated and non-irrigated fields rise and fall in tandem. There is a distinct rise, fall, and stagnation of yields from both irrigated and non-irrigated fields across all districts that indicate a broad environmental effect. This is especially true when examining the smoothed splines (lambda of 0.05) of the state. There is a noticeable dip in state yields after 2005, suggesting greater yield influence from the East Central and Southeast districts.
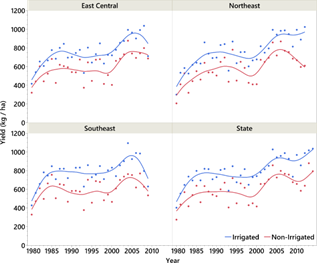
Figure 2. The annual yield (kg/ha-1) and smoothed splines (lambda = 0.05) for both irrigated and non-irrigated yields in each agricultural district and for the state of Arkansas from 1980 until the end of data reporting from NASS. Each dot is of the annual yield (kg/ha-1) reported in each agricultural district or state.
State yield data illustrates that the greatest disparity between irrigation types occurred during the 1980-1989 period, as more fields began to incorporate irrigation. Non-irrigated fields also experienced increased yield, though not to the same extent as irrigated fields. On average, the disparity between irrigated and non-irrigated fields has remained similar since the early 1980’s (Table 1). This suggests that the region received a fair amount of rainfall that maintains a consistent 21-25% average difference between the two irrigation strategies. A multifactor analysis of precipitation to yield for each district, month, and period indicate only one significant relationship in the Southeast agricultural district of non-irrigated fields from 1980-1989 during August (p =.0460). Only a limited number of precipitation effects were significant, with non-irrigated fields experiencing greater interaction with temperatures. However, of note is that the East Central agricultural district did not have any significant effect associated with precipitation by yield, indicating that there is enough rainfall in the region (Table 2). Moreover, across the state the largest influence of precipitation is in the month of August, with significant interactions occurring for irrigated cotton in 1980-1989 (p =.0175), and non-irrigated cotton in 1980-1989 (p =.0118) and for the duration of analyses, 1980-2014 (p =.0445). Whereas for the districts of the Northeast and Southeast the majority of the interactions occur in July.
Table 1. Percent difference in yield between irrigated and non-irrigated crops for each time period and district investigated.
| Time Period | East Central | Northeast | Southeast | State |
| 1980-1989 | 21.4% | 24.4% | 21.0% | 25.9% |
| 1990-1999 | 23.1% | 22.4% | 27.1% | 25.4% |
| 2000-2009 | 20.5% | - | 24.8% | - |
| 2000-2012 | - | 22.9% | - | - |
| 2000-2014 | - | - | - | 22.4% |
| 1980-Current | 21.7% | 23.2% | 24.3% | 24.6% |
Table 2. All factor combinations of precipitation using a quadratic regression that were significant at or below the 0.05 level.
| Agricultural District | Irrigation | Time Period | Month | Slope Coefficient (kg / ha/ cm) | R2 | P-Value |
| State | Irrigated | 1980-1989 | August | -7.14 | .685 | .0175 |
| Non-Irrigated | 1980-1989 | August | 11.48 | .719 | .0118 | |
| 1980-2014 | August | 19.76 | .177 | .0445 | ||
| East Central | Irrigated | NS | ||||
| Non-Irrigated | NS | |||||
| Northeast | Irrigated | 1980-2012 | July | 14.47 | .305 | .0051 |
| Non-Irrigated | 2000-2012 | July | 13.67 | .561 | .0247 | |
| 1980-2012 | June | 9.21 | .232 | .0220 | ||
| July | 15.43 | .434 | .0003 | |||
| Southeast | Non-Irrigated | 1980-1989 | August | 21.01 | .518 | .0293 |
| 2000-2009 | July | 12.70 | .575 | .0500 | ||
Modern cultivars appear to have become more sensitive to precipitation effects since 2000 (Table 2). This sensitivity to minor rainfall events hints at the constriction of genetic robustness in the cotton plant at the expense of faster flowering and greater yield potentials. Typically, cotton’s innate tolerance to drought conditions are due to deeper taproots, greater lateral root branching, and higher root-to-shoot ratios (Cook, 1985; Pace et al., 1999). However, it has been observed that frequent watering cycles do increase yields (Radin et al., 1992; Hunsaker et al., 1998), but the root systems are much shallower and more sensitive to environmental effects such as heat (Plaut et al., 1996). Overall however, yields of non-irrigated fields are increasing and could be linked to better management practices such as pesticide (Malo et al., 2000; Oerke, 2006) and weed management changes (Werth et al., 2013).
There was an extended period of yield stagnation and slow decline for all agricultural districts from the mid-1980’s until near 2000 (Figure 2). This extended period was prevalent even as newer cultivars were introduced (Malo et al., 2000; Meredith Jr., 2002). This stagnation and decline was not an isolated incident as was summarized by Paterson et al. (2004) who illustrated that the entire United States cotton growing region was affected by declining yields through this time. The accredited reasoning was that cotton had achieved a genetic bottleneck (Iqbal et al., 2001, 2005), and therefore cultivars at the time had achieved their maximum genetic potential for the environment.
Significant Arkansas state and agricultural district yields of all decadal trends were summarized in Table 3. From 1985-2000, the Northeast district had nonsignificant irrigated and non-irrigated declines of 2.5 kg-1 ha-1 year-1 (p =.3938) and 5.9 kg/ha-1/year (p =.0866), respectively. The East Central district in the center of the cotton production areas of the state also had statistically insignificant declines for irrigated (p =.2027) of -3.3 kg/ha-1/year, but significant non-irrigated (p =.0465) declines -6.1 kg/ha-1/year. The Southeast district had statistically insignificant irrigated declines of only 1.0 kg/ha-1/year (p =.9592), but nearly significant non-irrigated declines of more than 6.4 kg/ha-1/year (p =.0507). In total, the state observed an insignificant cotton yield decline of 3.5 kg/ha-1/year for irrigated (p =.1232), but a statistically significant decline of near 7.1 kg/ha-1/year for non-irrigated fields (p =.0237). This is in partial accordance to Paterson et al. (2004), since there was no distinction in their study between irrigated or non-irrigated yields. However, we do accept that reduced genetic variability had a significant role in the yield stagnation at the time.
Table 3. All factor combinations of temperature using a quadratic regression that were significant at or below the 0.05 level.
| Agricultural District | Irrigation | Time Period | Month | Temperature | Slope Coefficient (kg / ha/ °C) | R2 | P-Value |
| State | Irrigated | 1980-1989 | July | Maximum | -38.3 | .655 | .0241 |
| 1990-1999 | August | Maximum | -60.25 | .779 | .0051 | ||
| Minimum | -60.17 | .773 | .0008 | ||||
| 1980-2014 | July | Maximum | -47.64 | .309 | .0027 | ||
| Minimum | -51.61 | .191 | .0335 | ||||
| August | Minimum | 47.01 | .313 | .0080 | |||
| Non-Irrigated | 1980-1989 | July | Maximum | -39.00 | .735 | .0096 | |
| 1990-1999 | August | Maximum | -59.78 | .770 | .0058 | ||
| Minimum | -73.21 | .623 | .0327 | ||||
| 2000-2014 | June | Minimum | -35.22 | .530 | .0108 | ||
| 1980-2014 | July | Maximum | -56.92 | .388 | .0004 | ||
| Minimum | -71.94 | .322 | .0020 | ||||
| Northeast | Irrigated | 1980-1989 | August | Maximum | -50.43 | .794 | .0040 |
| 1990-1999 | August | Minimum | -65.69 | .620 | .0339 | ||
| 1980-2012 | July | Minimum | -67.71 | .231 | .0195 | ||
| Non-Irrigated | 1980-1989 | August | Maximum | -34.97 | .155 | .0235 | |
| 1990-1999 | August | Maximum | -87.68 | .691 | .0165 | ||
| 1980-2012 | July | Maximum | -44.03 | .205 | .0320 | ||
| Minimum | -81.17 | .391 | .0006 | ||||
| East Central | Irrigated | 1980-1989 | July | Minimum | -101.1 | .560 | .0128 |
| 1990-1999 | August | Maximum | -64.3 | .618 | .0345 | ||
| 1980-2009 | July | Maximum | -56.51 | .436 | .0004 | ||
| Minimum | -51.42 | .221 | .0345 | ||||
| Non-Irrigated | 1980-1989 | July | Maximum | -42.5 | .653 | .0247 | |
| Minimum | -85.4 | .706 | .0137 | ||||
| 1990-1999 | August | Maximum | -86.8 | .768 | .0060 | ||
| 2000-2009 | August | Maximum | -37.2 | .417 | .0436 | ||
| 1980-2009 | July | Maximum | -66.87 | .549 | .0001 | ||
| Minimum | -54.4 | .240 | .0245 | ||||
| August | Maximum | -49.5 | .308 | .0070 | |||
| Southeast | Irrigated | 2000-2009 | August | Minimum | 64.5 | .712 | .0128 |
| 1980-2009 | August | Minimum | 21.16 | .313 | .0076 | ||
| Non-Irrigated | 1980-1989 | July | Maximum | -27.20 | .623 | .0330 | |
| 1990-1999 | August | Maximum | -61.35 | .778 | .0052 | ||
| Minimum | -64.75 | .601 | .0402 | ||||
| 2000-2009 | July | Maximum | -52.21 | .369 | .0004 | ||
| 1980-2009 | July | Maximum | -48.34 | .463 | .0002 |
Yields increased after the introduction of genetically modified cotton and use throughout the state in the early 2000’s (Figure 2). Nevertheless, by the end of data reporting, irrigation fields in the Southeast district began to experience yield declines or stagnation. Similarly, non-irrigated yields in the Southeast ceased increasing yields towards the end of 2000’s. Irrigated fields in the Northeast district experienced the greatest yield increase of 18.9 kg/ha-1/year (p= <.0001, Table 3), while the Northeast district non-irrigated fields were statistically insignificant at 3.8 kg/ha-1/year (p =.4441) by the end of data collection in 2012. The East Central district after the year 2000 experienced the most rapid increase in yield of examined non-irrigated fields; increasing by a statistically significant 21.5 kg/ha-1/year (p = 0.0025). Also, irrigated fields in the East Central district increased at a significant 14.9 kg/ha-1/year (p =.0341) until data cessation in 2009. The state altogether experienced a significant increase in yields for both irrigated (p = <.0001) at 13.4 kg/ha-1/year and for non-irrigated fields (p =.0137) at 9.4 kg/ha-1/year.
Examinations of more recent yield trends indicate that from 2010 until 2014 state trends experienced a rapid increase in yields of both irrigation strategies (Figure 2). Irrigated fields across the state experiences a significant increase of near 29.5 kg/ha-1/year (p =.0070, Table 3) while non-irrigated fields increased at a 56.9 kg/ha-1/year (p =.0018). Tables 4 and 5 show the monthly averages for the maximum and minimum temperatures for the state of Arkansas as well as the agricultural districts and respective periods. There were no weather related trends found in the average monthly maximum or minimum temperatures, suggesting that temperatures in the region have remained consistent over the long term.
Table 4. Average decadal maximum temperature for each analyzed agricultural district and month in Arkansas spanning from 1980 - 2014.
| Agricultural District | ||||||||||||
| Time Period | Arkansas State | Northeast | East Central | Southeast | ||||||||
| June | July | August | June | July | August | June | July | August | June | July | August | |
| 1980-2014 | 31.6 | 33.2 | 33.0 | 31.3 | 33.4 | 32.6 | 31.1 | 32.8 | 32.4 | 31.6 | 33.2 | 33.1 |
| 1980-1989 | 31.6 | 33.3 | 32.6 | 31.3 | 33.6 | 32.7 | 31.6 | 33.5 | 32.6 | 31.9 | 33.4 | 33.3 |
| 1990-1999 | 31.3 | 33.4 | 32.7 | 30.8 | 32.8 | 32.1 | 30.9 | 32.9 | 32.1 | 31.3 | 33.4 | 32.7 |
| 2000-2009 | 31.7 | 33.2 | 33.7 | 31.1 | 32.5 | 32.6 | 30.8 | 31.8 | 32.5 | 31.0 | 32.4 | 33.1 |
| 2010-2014 | 32.4 | 32.5 | 33.1 | 32.0 | 32.5 | 33.1 | 32.6 | 32.5 | 33.1 | 30.9 | 31.8 | 33.0 |
Table 5. Average decadal minimum temperature for each analyzed agricultural district and month in Arkansas spanning from 1980 - 2014.
| Agricultural District | ||||||||||||
| Time Period | Arkansas State | Northeast | East Central | Southeast | ||||||||
| June | July | August | June | July | August | June | July | August | June | July | August | |
| 1980-2014 | 20.7 | 22.0 | 21.2 | 19.4 | 21.7 | 20.7 | 20.1 | 21.7 | 20.9 | 20.5 | 22.0 | 20.9 |
| 1980-1989 | 20.2 | 22.1 | 21.2 | 19.5 | 22.2 | 21.2 | 20.0 | 21.7 | 20.8 | 20.3 | 21.8 | 20.9 |
| 1990-1999 | 20.9 | 22.6 | 20.8 | 19.7 | 21.7 | 20.2 | 20.1 | 21.7 | 20.0 | 20.5 | 22.1 | 20.2 |
| 2000-2009 | 20.5 | 21.5 | 21.1 | 18.8 | 20.8 | 20.7 | 20.2 | 21.8 | 21.8 | 20.8 | 22.0 | 21.7 |
| 2010-2014 | 21.3 | 22.0 | 21.8 | 17.9 | 21.3 | 22.5 | 22.9 | 24.0 | 23.4 | 20.6 | 21.6 | 23.3 |
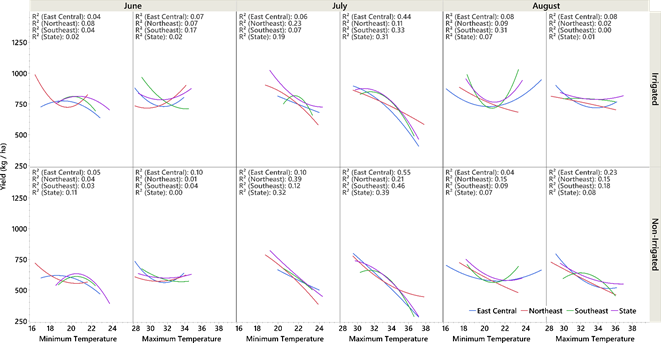
Figure 3. The quadratic trend line and associated R2 value of the effect of temperature on both irrigated and non-irrigated fields of each agricultural districts and the state of Arkansas for each month of reproductive development.
Quadratic analyses of yield to temperature indicated significant trends between the different agricultural districts in relation to temperature and month (Figure 3). Across all agricultural districts of the state, June minimum temperatures did not possess any correlated effects on yield to irrigation type. However, the effects of July minimum temperatures were pronounced across the state. July minimum temperatures had a significant effect on irrigated yields in the Northeast district with decreases of 67.7 kg/ha-1 for each 1°C increase (R2 = 0.23, p =.0195), and the state as a whole had irrigated yield decreases of 51.6 kg/ha-1 for each 1°C increase (R2 = 0.19, p =.0335). Increased minimum temperatures in July on non-irrigated fields had significant decreases in yield for the Northeast district with a decrease of 81.2 kg/ha-1 for each 1°C increase (R2 = 0.39, p =.0001), as well as for the state as a whole with decreases of near 71.9 kg/ha-1 for each 1°C increase (R2 = 0.32, p =.0006). In August, increased minimum temperatures had an unusual response in the Southeast district with warmer temperatures having a parabolic response of 47.0 kg/ha-1 for each 1°C increase (R2 = 0.31, p =.0076) on either side of a 20.9°C threshold. Earlier planting of cotton in the southeast district, and subsequently greater accumulation of heat units could explain this unusual response. Since cotton is a perennial grown as an annual (Wendel et al., 1992) any additional heat units accumulated is transferred into additional flower and boll development leading to greater yields (Bilbro and Ray, 1973).
Maximum temperature quadratic analyses of yield indicated significant trends between the different agricultural districts in relation to temperature and month (Figure 3). The influence of maximum temperatures in June had a significant impact on irrigated yields in the Southeast district with a decrease of 49.6 kg/ha-1 for each 1°C increase (R2 = 0.17, p =.0298), though no other districts of either irrigation strategy were significantly affected by increased maximal June temperatures. Increased maximum temperatures in July had a significant response on near all agricultural districts, with the exception being irrigated fields in the Northeast district, which although a decreasing trend, was not significant. Irrigated fields in the East Central district were highly affected by increased daily temperatures with a decrease of 57.1 kg/ha-1 for each 1°C increase (R2 = 0.44, p =.0004). Irrigated fields in the Southeast district had decreases of 44.3 kg/ha-1 for each 1°C increase (R2 = 0.33, p =.0051). Across the entire state, irrigated yields were significantly affected and decreased 47.6 kg/ha-1 for each 1°C increase (R2 = 0.31, p =.0027). Non-irrigated yields appeared more significantly affected by increased maximal temperatures. The East Central district experienced significant decreases of 66.5 kg/ha-1 for each 1°C increase (R2 = 0.55, p = <.0001), while the Northeast district decreased yields by 44.0 kg/ha-1 for each 1°C increase (R2 = 0.21, p =.0320). Fields in the Southeast district had highly significant decreases of 48.3 kg/ha-1 for each 1°C increase (R2 = 0.46, p =.0002). Overall, non-irrigated yields decreased significantly by 56.9 kg/ha-1 for each 1°C increase (R2 = 0.39, p =.0004) of July maximum temperatures. August maximum temperatures experienced fewer significant correlations to yield (Figure 3) compared with July, where no significant correlations for irrigated fields were identified. Non-irrigated fields were significantly decreased in the East Central district with decreases of 35.0 kg/ha-1 for each 1°C increase (R2 = 0.23, p =.0274).
Because decadal trends were identified within each agricultural district (Figure 2), we investigated the relationship between yield, temperature, and month as categorized according to decades. Figure 4 indicates the effect temperature had on yield by month with decadal periods for the entire state. In the 1980’s irrigated and non-irrigated cotton were not affected by either maximum or minimal temperatures in June. However, irrigated fields in July had decreased yields of 38.3 kg/ha-1 for each 1°C increase of maximum temperatures (R2 =.65, p =.0241), and similarly non-irrigated fields also decreased by 39.0 kg/ha-1 for each 1°C increase (R2 = 0.73, p =.0096). Although there was high correlation of July minimum temperatures and yield it was not significant (R2 =.51, p =.0804). Higher temperatures in August did not have any significant effect on yield for both irrigated and non-irrigated fields of the 1980’s.

Figure 4. The quadratic analyses of decadal trends of temperature on irrigated and non-irrigated fields in the state of Arkansas by each month of reproductive development.
During the 1990’s, there was a stagnation of yield (Figure 2) for all agricultural districts in Arkansas, and yields decreased towards the end of the decade. June temperatures did not have any significant impact on yield for either irrigated or non-irrigated cotton. There was greater correlation of maximal temperatures in July than in June, though irrigated cotton was not significantly influenced by high temperatures during the 1990’s (R2 =.52, p =.0781). Non-irrigated yield, though, was significantly influenced by greater maximum temperatures decreasing 69.7 kg-1 ha-1 for each 1°C increase (R2 = 0.60, p =.0399). In August, maximum temperatures of irrigated cotton was nearly significant in influencing yield decreasing 38.0 kg/ha-1 for each 1°C increase (R2 = 0.57, p =.0522), but increasing minimum temperatures greatly affected yields decreasing by 60.2 kg/ha-1 for each 1°C increase (R2 = 0.78, p =.0051). August non-irrigated yields decreased significantly by 59.8 kg/ha-1 for each 1°C increase (R2 = 0.77, p =.0058) of maximum temperature and decreased by 73.2 kg/ha-1 for each 1°C increase (R2 = 0.62, p =.0327) of minimum temperature.
From 2000-2014, yields increased across the state for all agricultural districts and irrigation strategies. However, temperatures did not have a significant influence on decreasing yields across the state. The only significant interaction occurred in June for non-irrigated crops, decreasing yields by 35.2 kg/ha-1 for each 1°C increase (R2 = 0.53, p =.0108) of minimum temperatures. Similar trends were also identified in other agricultural districts and summarized in Table 5.
Table 5. Average decadal precipitation averages for each analyzed agricultural district and month in Arkansas spanning from 1980 - 2014.
| Agricultural District | ||||||||||||
| Time Period | Arkansas State | Northeast | East Central | Southeast | ||||||||
| June | July | August | June | July | August | June | July | August | June | July | August | |
| 1980-2014 | 9.26 | 8.17 | 5.63 | 11.01 | 11.34 | 8.03 | 3.39 | 3.57 | 2.56 | 12.83 | 8.99 | 7.04 |
| 1980-1989 | 10.75 | 6.94 | 5.00 | 7.03 | 5.88 | 5.16 | 2.93 | 3.39 | 2.41 | 22.28 | 11.55 | 7.42 |
| 1990-1999 | 7.53 | 7.07 | 4.54 | 9.06 | 8.74 | 7.41 | 3.83 | 3.58 | 1.95 | 9.75 | 9.35 | 4.58 |
| 2000-2009 | 10.19 | 10.76 | 7.00 | 17.67 | 21.15 | 12.34 | 3.16 | 3.67 | 2.37 | 8.89 | 7.15 | 6.83 |
| 2010-2014 | 7.25 | 6.07 | 8.03 | 9.56 | 7.86 | 6.42 | 3.17 | 2.30 | 2.15 | 8.05 | 7.45 | 13.13 |
One unusual finding was that irrigated cotton of the 1980’s appeared to benefit from warmer minimum temperatures in August. State analysis identified that from 1980–2014 yields increased by 47.01 kg/ha-1 for each 1°C increase (R2 = 0.313, p =.008). This appears to be buoyed by the Southeast district which had significantly increased yields with warmer minimum temperatures from 2000-2009 with increases of 64.5 kg/ha-1 for each 1°C increase (R2 = 0.712, p =.0128) and over the long-term with increases of 21.2 kg/ha-1 for each 1°C increase (R2 = 0.313, p =.0076). Non-irrigated cotton did not exhibit any increases, nor did any other district. The Southeast district generally plants at an earlier time than the more northern districts and thus could have increased yields from the longer growing season. Additionally, during boll fill increased temperatures can improve micronaire and fiber strengths leading to premium prices (Wanjura and Barker, 1985; Hake and Silvertooth, 1990; Pettigrew, 2008). Additionally, boll maturation periods shortens by about 7 days per degree increase in average temperature (Reddy et al., 1997) which can translate into a longer growing season with more nodes (Reddy et al., 1991) and more bolls. Thus, in the Southeast district with earlier plantings compared to the more northern districts, a longer season coupled with a greater accumulation of heat units may be why higher minimum August temperatures increased yields.
4. Conclusion
Increasing yields in the Mississippi Delta region of the United States requires irrigation. Expected cotton yield increases by as much as 25% over non-irrigated fields. However, because historical trends indicate that irrigated and non-irrigated fields parallel in their historical trends of yield increases or decreases, precipitation effects did not appear to be a limiting factor to yield in the region. This is in part due to the region receiving significant rainfall amounts to recharge soil moisture levels early in the season (Bengtson et al., 1995), plus cotton’s inherent drought tolerance (Nepomuceno et al., 1998; Basal et al., 2005). Thus, temperature was determined to be the overriding impact factor that causes large swings in yield production from year to year.
Historical evidence indicates that in the state of Arkansas, precipitation events in July increase yields significantly more so for non-irrigated fields. This analysis has demonstrated that increased maximal and minimal temperatures in July are the most damaging times for cotton yield across all agricultural districts, and increased precipitation during this time can increase yields. The timing of planting can make a significant impact on when flowering will occur, therefore the time of flowering, heat stress severity, and low precipitations must coincide for the greatest negative impact on yield.
There is also a difference in the decadal trends across the growing region, with a long period of yield stagnation during the 1980’s through the 1990’s. This unproductivity has been attributed to the genetic "bottlenecking" of cotton genome yield capacity (Iqbal et al., 2001, 2005), but better yielding cultivars and better field managements have led to significantly greater yields within the past decade. However, these improved cultivars still possess the same sensitivity to heat and precipitation during flowering as older cultivars.
This study has demonstrated that increased temperatures have a greater impact on yield in the Mississippi Delta compared to precipitation. Some key points were identified in this study to mitigate yield loss due to temperature stress. Firstly, if irrigation timings are focused to the weeks surrounding flowering, final yields will generally increase. Secondly, heavy irrigation in the month of squaring did not improve yields. Thirdly, planting earlier maturing cultivars, or seeding as early in the season as possible can offset the damage to yield, by altering the timing of the reproductive period when deleterious effects occur. In conclusion, though yields of both irrigated and non-irrigated fields have been increasing, the yearly volatility suggests that current cultivars in the region remain vulnerable to both heat and drought stress.
References


