| 1. | ||
| 2. | ||
| 3. | ||
| 3.1. | ||
| 3.2. | ||
| 4. | ||
Water Quality Assessment of Deep Aquifer for Drinking and Irrigation Purposes in Selected Coastal Region of Bangladesh
Md. Shahin Hossin1, Md. Abdul Matin2, Mohammad Kabirul Islam1, Md. Mustafizur Rahman3, Morsheda Akter Mukta4, Md. Sagirul Islam Majumder5, *
1Department of Soil Science, Patuakhali Science and Technology University, Patuakhali, Bangladesh
2Department of Soil Science, Bangladesh Agricultural University, Mymensingh, Bangladesh
3Agriculture Training Institute (ATI), Faridpur, Bangladesh
4Department of Agriculture, L.A.M. United Mohila College, Dumki, Patuakhali, Bangladesh
5Department of Subtropical Agro-Production Science, University of the Ryukyus, Okinawa, Japan
Email address
 (Md. S. I. Majumder)
 Citation
Md. Shahin Hossin, Md. Abdul Matin, Mohammad Kabirul Islam, Md. Mustafizur Rahman, Morsheda Akter Mukta, Md. Sagirul Islam Majumder. Water Quality Assessment of Deep Aquifer for Drinking and Irrigation Purposes in Selected Coastal Region of Bangladesh. American Journal of Agricultural Science. Vol. 3, No. 6, 2016, pp. 85-91.
Abstract
The present study focused on the hydrochemistry of groundwater in Mirzagonj upazila under Patuakhali district to assess the quality of groundwater for determining its suitability for drinking and irrigation purposes. Groundwater samples were collected from thirty stations of Mirzagonj upazila during dry season and were analyzed for physico-chemical parameters such as pH, EC, sodium, potassium, calcium, magnesium, phosphate, sulphate, carbonate and bicarbonate. The results of this study showed that, the status of groundwater was better for drinking purposes. The calculated values of sodium adsorption ratio (SAR) and soluble sodium percentage (SSP) indicated that the water was unsuitable but in case of residual sodium bicarbonate (RSBC) values it was suitable for irrigation uses. The concentrations of Ca2+, SO42-, PO43-, and HCO3- in all water samples were within the safe limit but the contents of Na+, Ca2+, Mg2+ and CO32- in some water samples were problematic for irrigation indicating these ions as pollutants. US Salinity diagram was used for evaluating the water quality for irrigation which suggests that the majority of the groundwater samples were unsuitable for irrigation.
Keywords
Water Quality, Deep Aquifer, Drinking and Irrigation, SAR, SSP, RSBC
1. Introduction
Groundwater is the main source for drinking, irrigation and industrial purposes. During last two decades the indiscriminate disposal of industrial waste on mother earth slowly makes groundwater susceptible to pollution. Due to rapid urbanization and industrialization the environmental pollution is increasing day by day so it is essential to assess the quality of groundwater for its safer use. Bangladesh is a land of rivers. Annual rainfall of the country is over 200 cm but its distribution is uneven [1]. About 85 percent of the total rainfall occurs during April-October. Rain water is unusual and the rivers also dry during Dry season. So, the groundwater has become the prime source of irrigation in dry period. About 70 percent irrigation water and 90 percent of total potable water in Bangladesh is supplied from groundwater [2]. Polluted groundwater is harmful both for human bodies and soil properties if it is used for drinking and irrigation purposes. The people of Mirzagonj upazila mainly used groundwater for drinking and to some extent for irrigation. Most of the lands of this area are not cultivated due to scarcity of available water because surface water becomes dry and rainfall does not occur during dry season. The peoples of this area can overcome water shortage through the application of groundwater from hand tubewell. The water quality is important for long-term irrigation system because it influences the soil properties. The usual toxic elements in irrigation water are sodium, potassium, calcium, magnesium, carbonate, bicarbonate etc [3]. Irrigation water quality is also judged by some determining factors like sodium adsorption ratio (SAR), soluble sodium percentage (SSP), residual sodium bicarbonate (RSBC) and electrical conductivity (EC) [4]. Intensive irrigated agriculture with HYV crops under high inputs has already started showing problems in different regions of Bangladesh. In this aspect, it becomes a prime need to conduct field level investigations of the existing water management practices in rural areas of Bangladesh. Therefore, the objective of the present work is to analyze the major ionic constituents of the groundwater of Mirzagonj upazila and classify the water in order to appraise the water quality and its suitability for drinking and irrigation purposes using WHO (World Health Organization) drinking water standards and US salinity diagram.
2. Materials and Methods
The study was conducted at Mirzagonj upazila of Patuakhali district in Bangladesh during the month of December to March, 2008 following the procedure mentioned by [5] and [6]. Within the study area 30 groundwater samples were collected from 30hand tubewells. The depth of wells was within 800 to 1200 feet. The water samples were collected after 30 minutes of pumping to avoid stagnant and contaminated water. Two sets of samples were collected from the study area. One set was collected in 250 ml plastic bottles previously washed with distilled water and added 20ml 2N HCl (Hydrochloric acid). Another set was collected without HCl (Hydrochloric acid) and was sealed immediately to avoid exposure to air according to [7]. The containers were labeled for proper identification and those were brought to the laboratory of the Department of Soil Science and Agricultural Chemistry in Bangladesh Agriculture University, Mymensingh, for analyses. The groundwater samples were analyzed for physical parameters like pH and EC and chemical parameters like sodium (Na+), potassium (K+), calcium (Ca2+), magnesium (Mg2+), phosphate (PO43-), sulphate (SO42-), carbonate (CO32-) and bicarbonate (HCO3-). The pH was determined electrometrically following the procedure mentioned by [8] and electrical conductivity was determined electrometrically according to the method given by [9]. Calcium, sodium and potassium were estimated by flame emission spectrophotometer by using calcium, sodium and potassium filters, respectively [8]. Magnesium was analyzed by complexometric method of titration using disodium ethylene diamine tetra-acetate according to [10]. Sulphate was determined turbidimetrically [11]. Carbonate and bicarbonate were determined by titration method [8]. Phosphate was determined colorimetrically according to procedure outlined by APHA [6]. Waters under test were classified as per results obtained from chemical analyses.
The SAR is used to predict the sodium hazard of high carbonate waters especially if they contain no residual alkali. The excess sodium or limited calcium and magnesium are evaluated by SAR [12]
![]() (1)
(1)
Soluble Sodium Percentage (SSP) was calculated by the equation proposed by Todd (1980);
SSP= {(Na+ +K+)/(Ca2++Mg2++Na++K+)}×100 (2)
The Residual Sodium Bicarbonate (RSBC) was calculated based on the equation given by Gupta and Gupta (1987);
RSBC = (HCO3--Ca2+) mgL-1 (3)
Correlation analysis among different ionic constituents like Ca2+, Mg2+, Na+, K+, PO43-, SO42-, CO32-, HCO3- and different quality indicators such as pH, EC, SAR, SSP, RSBC etc. were done to establish relationship among them following the standard method of computer program (SPSS).
3. Results and Discussions
The various physico-chemical parameters of groundwater in Mirzagonj upazila under Patuakhali district was illustrated table-1. The permissible limit of pH, Electrical Conductivity (EC), Calcium (Ca2+), Magnesium (Mg2+), Sodium (Na+), Potassium (K+), Sulphate (SO42-), Phosphate (PO43-), Carbonate (CO32-) and Bicarbonate (HCO3-) in drinking was shown in table-2 according to World Health Organization (WHO) [13]. Classification of the collected groundwater on the basis of EC, SAR, SSP and RSBC for irrigation is shown in table-4, 5, 6 and 7. Correlation matrix (r) among different ionic constituents of groundwater is shown in table-8 and Correlation co-efficient (r) and regression equation among different quality parameters of water samples is shown in table-9. Major cations and anions are expressed in milligram per liter (mgL-1). The unit used for measuring EC is micro-Siemens per centimeter (µScm-1).
3.1. Drinking Water Quality
The quality of groundwater is as important as its quantity because it is the main factor determining its suitability for domestic, drinking, agricultural and industrial purposes. The pH value of drinking water is an important index of acidity and alkalinity. The pH usually has no direct impact on human health. The results revealed that pH ranged from 7.1 to 7.7 with an average value of 7.3 (Table-1). This shows that the groundwater of the study area is mainly alkaline in nature. Permissible limit for pH is 6.5 to 8.5 [13]. So, all drinking water samples were found to be within limit (Table-2). The EC is a numerical expression of ability of an aqueous solution to carry electric current. Recommended permissible limit for electrical conductivity (EC) is 1400µScm-1 [13]. The range of Electrical Conductivity (EC) was 771µScm-1 to 1802µScm-1 with an average value of 1042.25µScm-1 (Table-3). By analyzing the results, all water samples showed EC under the permissible limit except sample number 1, 5 and 11 (Table-2). The average concentration of major ions in groundwater was in the following order: Anions: - Bicarbonate>Sulphate> Phosphate> Carbonate while Cations: - Sodium> Magnesium> Potassium> Calcium. The Calcium (Ca2+) value of the water samples varied from 1.11 mg/L to 6.66 mg/L with an average value of 2.10 mg/L (Table-1). The desirable limit of Ca2+ for drinking water is 75 mg/L [13]. It was observed that all samples were under this limit. The Magnesium (Mg2+) concentration in the samples varied from 9.72 mg/L to 38.22 mg/L with a mean value of 17.12 mg/L (Table-1). The desirable value of Mg2+ is 50 mg/L [13]. So, all samples were in this limit (Table-2). Sodium (Na+) concentration in the water samples ranged from 126.54 mg/L to 182.29 mg/L with the mean value of 145.64 mg/L (Table-1). Permissible limit of Na+ for safe drinking water is 200 mg/L [13]. That’s why the collected water can safely be used for drinking purpose.
Table 1. Chemical compositions of the collected groundwater samples.
| SL. No. | Sources of water | pH | Ca2+ (mgL-1) | Mg2+ (mgL-1) | Na+ (mgL-1) | K+ (mgL-1) | SO42- (mgL-1) | PO43- (mgL-1) | CO32- (mgL-1) | HCO3- (mgL-1) |
| 1 | HTW | 7.5 | 3.33 | 23.32 | 166.50 | 3.55 | 4.56 | 0.53 | 0 | 4.50 |
| 2 | HTW | 7.4 | 2.22 | 20.73 | 166.50 | 3.12 | 3.31 | 0.68 | 0 | 8.50 |
| 3 | HTW | 7.3 | 1.11 | 11.67 | 146.52 | 2.66 | 3.04 | 0.60 | 0.70 | 7.50 |
| 4 | HTW | 7.2 | 1.11 | 10.69 | 128.76 | 1.78 | 2.74 | 0.23 | 0.30 | 4.60 |
| 5 | HTW | 7.7 | 6.66 | 38.22 | 182.29 | 4.42 | 3.79 | 0.95 | 0 | 8.80 |
| 6 | HTW | 7.1 | 1.11 | 9.72 | 129.87 | 1.78 | 3.07 | 0.34 | 1.00 | 8.10 |
| 7 | HTW | 7.2 | 1.11 | 9.72 | 134.31 | 1.78 | 2.74 | 0.32 | 0.30 | 7.20 |
| 8 | HTW | 7.3 | 2.22 | 20.41 | 165.39 | 2.89 | 3.07 | 0.74 | 1.00 | 7.90 |
| 9 | HTW | 7.2 | 1.11 | 10.58 | 132.09 | 2.22 | 3.05 | 0.79 | 0.50 | 4.50 |
| 10 | HTW | 7.2 | 1.11 | 13.61 | 135.42 | 2.22 | 3.31 | 0.73 | 0.40 | 8.70 |
| 11 | HTW | 7.5 | 5.55 | 31.11 | 175.23 | 3.33 | 3.66 | 0.83 | 0.60 | 6.40 |
| 12 | HTW | 7.2 | 1.11 | 10.69 | 130.53 | 1.55 | 2.73 | 0.50 | 0.40 | 5.50 |
| 13 | HTW | 7.2 | 2.22 | 11.67 | 133.20 | 1.78 | 3.66 | 1.20 | 0.80 | 7.60 |
| 14 | HTW | 7.2 | 2.22 | 12.64 | 137.64 | 2.89 | 4.08 | 0.67 | 0.20 | 7.20 |
| 15 | HTW | 7.2 | 1.11 | 12.44 | 136.53 | 2.44 | 4.07 | 0.78 | 0.30 | 6.80 |
| 16 | HTW | 7.2 | 1.11 | 10.49 | 134.30 | 2.44 | 3.36 | 0.76 | 0.60 | 8.30 |
| 17 | HTW | 7.2 | 1.11 | 12.49 | 135.42 | 2.00 | 1.92 | 0.69 | 0.50 | 7.50 |
| 18 | HTW | 7.3 | 2.22 | 19.44 | 157.62 | 2.89 | 1.63 | 0.50 | 1.00 | 7.90 |
| 19 | HTW | 7.3 | 2.22 | 19.44 | 163.17 | 3.12 | 2.02 | 0.44 | 0.70 | 8.20 |
| 20 | HTW | 7.4 | 2.55 | 18.47 | 162.06 | 3.12 | 2.30 | 0.47 | 0.80 | 8.60 |
| 21 | HTW | 7.2 | 1.11 | 12.64 | 136.53 | 1.78 | 2.23 | 0.45 | 0.40 | 7.20 |
| 22 | HTW | 7.3 | 2.22 | 16.53 | 159.84 | 2.89 | 3.17 | 0.65 | 0.60 | 8.30 |
| 23 | HTW | 7.4 | 2.85 | 21.39 | 162.95 | 2.89 | 4.03 | 0.58 | 0.60 | 8.10 |
| 24 | HTW | 7.5 | 4.44 | 30.12 | 163.17 | 3.22 | 3.98 | 0.56 | 0.40 | 8.20 |
| 25 | HTW | 7.2 | 1.11 | 16.53 | 133.2 | 2.22 | 3.39 | 0.57 | 0.30 | 8.20 |
| 26 | HTW | 7.2 | 1.11 | 14.58 | 126.54 | 2.00 | 3.50 | 0.76 | 0.30 | 7.90 |
| 27 | HTW | 7.2 | 2.22 | 19.72 | 135.42 | 1.78 | 2.64 | 0.44 | 0.20 | 7.60 |
| 28 | HTW | 7.4 | 3.33 | 26.67 | 150.94 | 2.32 | 3.12 | 0.51 | 0 | 7.60 |
| 29 | HTW | 7.2 | 1.11 | 13.61 | 139.86 | 2.66 | 3.02 | 0.61 | 0.30 | 8.00 |
| 30 | HTW | 7.2 | 1.11 | 11.67 | 138.70 | 2.70 | 3.07 | 0.68 | 0.50 | 7.60 |
| Range | 7.1-7.7 | 1.11-6.66 | 9.72-38.22 | 126.54-182.29 | 1.55-4.42 | 1.63-4.56 | 0.23-1.20 | 0-1.00 | 4.50-8.80 | |
| Mean(n=30) | 7.3 | 2.10 | 17.12 | 145.64 | 2.50 | 3.08 | 0.63 | 0.50 | 7.64 | |
| Sd(±) | 0.13 | 1.40 | 6.25 | 14.48 | 0.55 | 0.76 | 0.18 | 0.22 | 0.74 | |
| CV (%) | 1.78 | 66.67 | 36.51 | 9.94 | 22.00 | 24.58 | 28.37 | 44.00 | 9.69 | |
Potassium (K+) concentration in the water samples ranged from 1.55 mg/L to 4.42 mg/L with the mean value of 2.50 mg/L (Table-1). All the samples were under the permissible limit (Table-2). Sulphate values varied from 1.63 mg/L to 4.56 mg/L with the mean value of 3.08 mg/L (Table-1). The desirable limit of sulphate for drinking water is 400 mg/L [13]. All the water samples were in desirable limit. Phosphate values varied from 0.23 mg/L to 1.20 mg/L with the mean value of 0.63 mg/L. The desirable value of phosphate is 12 mg/L [13]. So, all the samples were in safe limit. Hard water is characterized with high mineral contents that are usually not harmful for humans. It is often measured as calcium carbonate (CaCO3) because it consist mainly calcium and carbonates the most dissolved ions in hard water. The hardness of water should be 500 mg/L [13]. In study areas, carbonate values of the collected samples varied from nil to 1.0 mg/L with the mean value of 0.50 mg/L. So, all the samples were in desirable limit. Bicarbonate values varied from 4.50 mg/L to 8.80 mg/L with the mean value of 7.64 mg/L and all samples were in desirable limit as per WHO standard [13].
Table 2. Showing permissible limit of pH, EC, Ca2+, Mg2+, Na+, K+, SO42-, PO43-, CO32- and HCO3- in drinking according to World Health Organization (WHO), 2006.
| Components | Permissible limit |
| pH | 6.5-8.5 |
| Electrical Conductivity (EC) | 1400 µScm-1 |
| Ca2+ | 75 mg/L |
| Mg2+ | 50 mg/L |
| Na+ | 200 mg/L |
| K+ | 55 mg/L |
| SO42- | 400 mg/L |
| PO43- | 12 mg/L |
| Hardness | 500 mg/L |
| HCO3- | 1000 mg/L |
3.2. Irrigation Water Quality
EC is a good measure of salinity hazard to crops. Excess salinity reduces the osmotic activity of plants and thus interferes with the absorption of water and nutrients from the soil [14]. The range of electrical conductivity was 771µScm-1 to 1802µScm-1 with mean value of 1042.25µScm-1(Table 3). Hence, all the samples under normal condition cannot be used for irrigation due to high salinity (Table 4). The SAR values in the water samples ranged from 38.22 to 57.91 with average value of 49.01. All the ground waters of the study area were of unsuitable for irrigation according to Todd [15].
Table 3. Sodium Absorption Ratio (SAR), Soluble Sodium Percentage (SSP) and Residual Sodium Bicarbonate (RSBC) values in the collected ground water samples.
| SL.No. | Sources of water | EC(µScm-1) | SAR | SSP (%) | RSBC (mgL-1) | Alkalinity and salinity hazard class |
| 1 | HTW | 1505 | 45.62 | 86.45 | 1.17 | C3S4 |
| 2 | HTW | 1280 | 49.12 | 88.08 | 6.28 | C3S4 |
| 3 | HTW | 1053 | 57.91 | 92.10 | 6.39 | C3S4 |
| 4 | HTW | 802 | 52.99 | 91.71 | 3.49 | C3S4 |
| 5 | HTW | 1802 | 38.22 | 80.42 | 2.14 | C3S4 |
| 6 | HTW | 771 | 55.74 | 92.39 | 6.99 | C3S4 |
| 7 | HTW | 812 | 57.64 | 92.63 | 6.09 | C3S4 |
| 8 | HTW | 1190 | 49.22 | 88.15 | 5.68 | C3S4 |
| 9 | HTW | 862 | 54.58 | 91.99 | 3.39 | C3S4 |
| 10 | HTW | 845 | 49.97 | 90.08 | 7.59 | C3S4 |
| 11 | HTW | 1761 | 40.94 | 82.97 | 0.85 | C3S4 |
| 12 | HTW | 850 | 53.72 | 92.13 | 4.39 | C3S4 |
| 13 | HTW | 842 | 50.45 | 90.67 | 5.38 | C3S4 |
| 14 | HTW | 922 | 50.41 | 90.43 | 4.98 | C3S4 |
| 15 | HTW | 860 | 52.51 | 91.12 | 5.69 | C3S4 |
| 16 | HTW | 802 | 55.73 | 92.23 | 7.19 | C3S4 |
| 17 | HTW | 868 | 51.89 | 90.99 | 6.39 | C3S4 |
| 18 | HTW | 1237 | 47.91 | 88.11 | 5.68 | C3S4 |
| 19 | HTW | 1240 | 49.59 | 88.48 | 5.98 | C3S4 |
| 20 | HTW | 1272 | 50.02 | 88.71 | 6.05 | C3S4 |
| 21 | HTW | 867 | 52.11 | 90.96 | 6.09 | C3S4 |
| 22 | HTW | 1097 | 52.24 | 89.67 | 6.08 | C3S4 |
| 23 | HTW | 1280 | 46.25 | 87.11 | 5.25 | C3S4 |
| 24 | HTW | 1426 | 39.22 | 82.80 | 3.76 | C3S4 |
| 25 | HTW | 844 | 44.85 | 88.47 | 7.09 | C3S4 |
| 26 | HTW | 822 | 45.19 | 89.12 | 6.79 | C3S4 |
| 27 | HTW | 842 | 40.91 | 86.21 | 5.38 | C3S4 |
| 28 | HTW | 1280 | 39.00 | 83.63 | 4.27 | C3S4 |
| 29 | HTW | 866 | 51.61 | 90.61 | 6.89 | C3S4 |
| 30 | HTW | 867 | 54.82 | 91.71 | 6.49 | C3S4 |
| Range | 771- 1802 | 38.22to57.91 | 80.42to92.63 | 0.85 to7.59 | ||
| Mean | 1042.25 | 49.01 | 89.00 | 5.33 | ||
| SD(±) | 265.86 | 5.54 | 3.20 | 3.10 | ||
| CV (%) | 25.51 | 11.23 | 3.60 | 3.50 | ||
Here, C3 = High salinity, S4 = Very high alkalinity, HTW = Hand tubewell water
The suitability of water for irrigation use can be determined by using the US salinity diagram [16]. The range of sodium hazard and salinity hazard were shown in the diagram. The estimated values of EC and SAR in the ground water samples of the study area were fall in the field of C3S4, indicating high salinity and very high alkalinity in water, which cannot be used for irrigation in any types of soil without danger of exchangeable sodium.
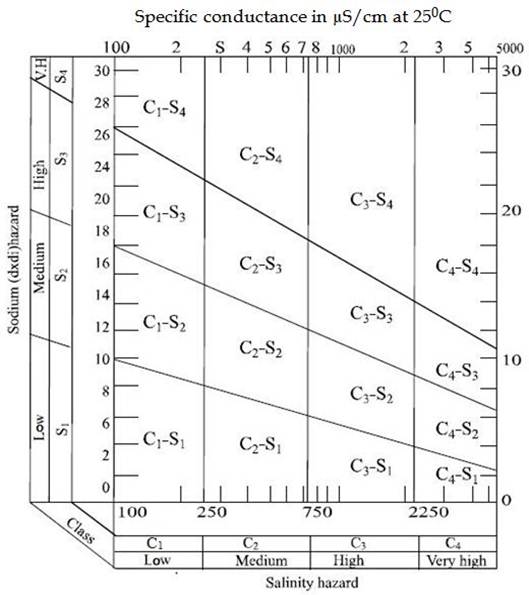
Figure 1. Classification of irrigation water using U.S. salinity diagram (Richards 1954).
Table 4. Quality of groundwater based on Electrical Conductivity.
| Salinity hazard class | Specific conductance (µScm-1) | Characteristics | Samples |
| Low | 0-250 | Low-salinity water can be used for irrigation on most soil with minimal likelihood that soil salinity will develop. | Nil |
| Medium | 251-750 | Medium-salinity water can be used for irrigation if a moderate amount of drainage occurs. | Nil |
| High | 750-2,250 | High-salinity water is not suitable for use on soil with restricted drainage. Even with adequate drainage, special management for salinity control may be required. | All samples |
| Very high | More than 2,250 | Very high-salinity water is not suitable for irrigation under normal conditions. | Nil |
Source: Wilcox, L.V. 1955. Classification and Uses of Irrigation Water USDA Circular No. 969.Washington D.C. p. 19.
Table 5. Quality of groundwater based on Sodium Absorption Ratio (SAR).
| SAR | Water suitability for irrigation | Samples |
| 0-10 | Suitable for all types of soils except for those crops which are highly sensitive to sodium. | Nil |
| 10-18 | Suitable for coarse textured or organic soil with good permeability. Relatively unsuitable in fine textured soil. | Nil |
| 18-26 | Harmful for almost all types of soils. Requires good drainage, high leaching and gypsum addition. | Nil |
| >26 | Unsuitable for irrigation. | All samples |
Source: Todd, D.K., 1980. Groundwater Hydrology J. 2ndEdn., Wiley and Sons Inc., New York, 10016. p.304.
Table 6. Quality of groundwater based on Soluble Sodium Percentage (SSP).
| SSP | Quality of water | Samples |
| <20 | Excellent | Nil |
| 20-40 | Good | Nil |
| 40-60 | Permissible | Nil |
| 60-80 | Doubtful | Nil |
| >80 | Unsuitable | All samples |
Source: Wilcox, L.V. 1955. Classification and Uses of Irrigation Water USDA Circular No. 969. Washington D.C., p. 19.
Table 7. Quality of groundwater based on Residual Sodium Bicarbonate (RSBC).
| RSBC (mgL-1) | Water suitability for irrigation | Samples |
| <5 | Water can be used safely | Samples1, 4, 5, 9, 11, 12, 14, 24 and 28 |
| 5.0-10.0 | Water can be used with certain management | Rest of all samples |
| >10.0 | Unsuitable for irrigation purposes | Nil |
Source: Gupta, S.K. andGupta,I.C.,1987. Management of Saline Soils and Water. Oxford and IBH Publication Coy, New Delhi, India, p. 399.
The water samples become unsuitable for irrigation when the SSP value is over 80% [17]. The SSP values were ranged from 80.42% to 92.63% in the water samples of the study area. So, all the ground water samples of the study area were rated as "unsuitable" class (Table 6). The RSBC values ranged from0.85mgL-1 to 7.59mgL-1 with the mean value of 5.33mgL-1. Waters having more than 10.0mgL-1 of RSBC are not suitable for irrigation purposes while those having 5.0-10.0mgL-1 are marginally suitable and those with less than 5.0mgL-1 are safe for irrigation [18] and the results shows that all the samples (except nine samples i.e. 1, 4, 5, 9, 11, 12, 14, 24 and 28) were marginal for irrigation. RSBC values in all the samples showed positive values which indicated that dissolved Ca2+ contents were less than HCO3- contents.
The correlation coefficient (r) among the major ionic constituents of ground water samples, namely pH, EC, Na+, K+, Ca2+,Mg2+,PO43-, SO42-, CO32- and HCO3- were calculated. According to table-8, the remarkable significant correlation existed between Ca2+ versus Mg2+ (r=0.94), Ca2+ versus Na+ (r=0.82), Ca2+ versus K+ (r=0.76), Ca2+ versus SO42- (r=0.37), Ca2+ versus PO43- (r=0.29), Mg2+ versus Na+ (r=0.84), Mg2+ versus K+ (r=0.76), Na+ versus K+ (r=0.89), Na+ versus CO32- (r=0.47), K+ versus SO42- (r=0.35), K+ versus CO32- (r=0.30), SO42- versus PO43- (r=0.42), and CO32- versus HCO3- (r=0.28). The relationships among different quality criteria of the water samples like pH, EC, SAR, SSP, RSBC were significantly correlated (Table 9). The relationship between any two variables is assumed to be good with correlation coefficient higher than 0.80. From this analysis, it can be observed that pH was found to be dependent on EC, SAR was dependent on both SSP and RSBC and SSP was dependent on RSBC. All other quality determining indicators produced correlation coefficient less than 0.80. The correlation coefficient between pH vs. EC was 0.97, SAR vs. SSP was 0.94, SAR vs. RSBC was 0.85 and SSP vs. RSBC was 0.96. The co-efficient of determination or linear relationship between pH vs. EC was found R2=0.94, SAR vs. SSP was R2=0.89, SAR vs. RSBC was R2=0.73 and SSP vs. RSBC was R2=0.93.
Table 8. Correlation matrix (r) of different ionic constituents of ground water samples.
| Ca2+ | Mg2+ | Na+ | K+ | SO42- | PO43- | CO32- | HCO3- | |
| Ca2+ | - | |||||||
| Mg2+ | 0.94** | - | ||||||
| Na+ | 0.82** | 0.84** | - | |||||
| K+ | 0.76** | 0.76* | 0.89** | - | ||||
| SO42- | 0.37* | 0.29NS | 0.19 NS | 0.35* | - | |||
| PO43- | 0.29* | 0.18 NS | 0.15 NS | 0.27 NS | 0.42* | - | ||
| CO32- | 0.19NS | 0.15 NS | 0.47* | 0.30* | -0.29 NS | 0.12 NS | - | |
| HCO3- | 0.13NS | 0.22 NS | 0.24 NS | 0.24 NS | -0.11 NS | 0.17 NS | 0.28* | - |
** Correlation is significant at 0.01 level of probability.
*Correlation is significant at 0.05 level of probability.
NS= Not significant.
Table 9. Correlation co-efficient (r) and regression equation among different quality parameters of water samples.
| Different parameters | Correlation co-efficient (r) | Regression equation | Co-efficient of determination (R2) |
| pH vs. EC | 0.97** | y= 2212.7x-15067 | 0.94 |
| pH vs. SAR | -0.63** | y= -28.274x+255.41 | 0.42 |
| pH vs. SSP | -0.84** | y= -21.159x+243.21 | 0.71 |
| pH vs. RSBC | -0.92** | y= -61.67x+438.15 | 0.85 |
| EC vs. SAR | -0.64** | y= -0.0126x+62.635 | 0.43 |
| EC vs. SSP | -0.84** | y= -0.0093x+98.903 | 0.72 |
| EC vs.RSBC | -0.92** | y= -0.027x+17.323 | 0.86 |
| SAR vs. SSP | 0.94** | y= 0.5448x-62.12 | 0.89 |
| SAR vs.RSBC | 0.85** | y= 1.3121x-76.046 | 0.73 |
| SSP vs.RSBC | 0.96** | y= 2.5669x-239.76 | 0.93 |
** Correlation is significant at the 0.01 level of probability.
4. Conclusion
Groundwater is an important source of drinking water for many people around the world. Contamination of groundwater generally results in poor drinking water quality, loss of water supply, high cleanup costs, high-cost alternative water supplies and potential health problem. From the observation, it may concluded that almost all the parameters like pH, EC, sodium, potassium, calcium, magnesium, carbonate and bicarbonate are within the permissible limits for drinking. On the other hand most of the sampling station considered unsuitable for irrigation uses according to EC, SAR and SSP values.
References


