| 1. | ||
| 2. | ||
| 3. | ||
| 4. | ||
| 5. | ||
The Change in Air Pressure Along the Length of the Pipeline Installation for Pneumatic Conveying of Raw Cotton
Sarimsakov Olimjon Sharipjanovich
Namangan Institute of Engineering and Technology, Namangan, Uzbekistan
Email address

Citation
Sarimsakov Olimjon Sharipjanovich. The Change in Air Pressure Along the Length of the Pipeline Installation for Pneumatic Conveying of Raw Cotton. Engineering and Technology. Vol. 3, No. 5, 2016, pp. 89-92.
Abstract
The article consider questions of definition of patterns of air pressure changes over the length of the pipe pneumatic transport systems for raw cotton, analysis and assessment of its dependence on the parameters of the flow, as theoretically justify the use of pipes of different diameters in the design of pneumatic transportation systems.
Keywords
Cotton, Pneumatic Transportation Systems, Operation Mode, Static Pressure, Dynamic Pressure
1. Formation in Pneumatic Conveying Installations of Aerodynamic Parameters
Pneumatic conveying installation, it is primarily the aerodynamic unit, which pumps air from one place to another [1], [2]. The difference is that in pneumatic conveying installation serves the material, which captures the moving air and throws at the destination. If judged on the merits, the air is also a material substance that has mass and volume, to transfer of which requires not less effort and energy. Thus, any object or substance being in contact with the air, especially moving air, will be under force action. If the walls of the duct the air having the static pressure, seeking to destroy the wall and the force of friction of air particles on the surface of the wall, seeking to carry the wall along with in the direction of movement, and if a particle or body in certain shapes and sizes – the forces of inertia and friction, which also tend to carry them in the direction of movement. However, the nature of the interaction of the air with other bodies (particles in particular) is so complex that the theoretical description of this process with all ending phenomena and effects impossible. For this, all the known theoretical background carried out with certain assumptions and the confluence of empirical approaches based on experimental data [3], [4], [5].
Studies have also established the pressure drop along the length of the pipeline. Connecting or removing 1 m of the pipeline or comorbities, separator, or bending is accompanied by a decrease or increase in pressure at the mouth of the pipeline. Often this is due to the pressure losses in pipelines [5], [6]. To establish regularities of change of pressure along the length of materialoved in the first place it is necessary to study the process of emergence pressure.
Analysis is feasible according to fig. 1.
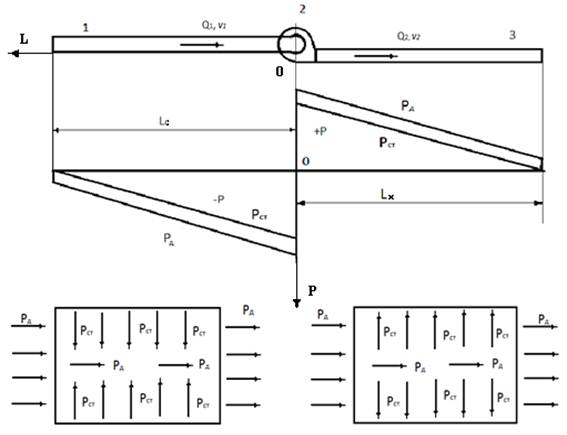
Fig. 1. A simplified diagram of the aerodynamic setup and direction of pressure pipelines.
Any aerodynamic setup contains at least 3 components, it is a fan 2, the incoming 1 and outgoing 2 pipelines. In any design fan pressure it creates impeller (or wheel) which, for a focused air flow, mounted inside a casing having inlet and outlet windows which are connected respectively to the input 1 and 2 exhaust pipes. During the rotation of the impeller (or the wheels cut the surrounding layers of air from the input window and throw them to the side of the output window. Moreover, the input window formed sparse, and output – rich (dense) environment.
The discharged medium is a vacuum, which attracts nearby particles, i.e., particles of air and creating acorridorfor the movement, formed astreamthat is part of the fan. Similarly, the repulsive force of the compacted environmental so forms a flow, only the exhaust. Fan binds these threads into one, i.e., during operation, the fan sucks air flow or Aero mixture on one side and out puts it to the other side. According to this, the indices of the incoming and outgoing flow is the same. Rate of discharge (also called compaction), in fact, is the indicator measured in units of force (or mass) per unit volume (this is the unit of density). However, to date no science of such a measure as an indicator of low (or compaction), there is no means of measurement. But, there is the concept of pressure, which is measured by the magnitude of the force per unit area.
This, the power that is in the field of vacuum pulling pipe wall to the center of the stream, and in the field of sealing pressure on pipe wall from the inside. And this power can be measured instrumental and attributing its importance to the area of action of this force determines the pressure value. In pipelines, the forces acting on the pipe wall perpendicular to cause static pressure Pct, the forces acting along the pipeline – dynamic Pд. Total pressure Pп is the algebraic sum of the absolute values ofPд the dynamic and static Рст pressure [6], [7]:
Рст= ρgh, (1)
Pд = 0.5ρn2, (2)
Pп = / Рст/ + / Pд /, (3)
Where ρ- is the density (kg/m3), ʋ - speed (m/s) of flow; g – gravitational acceleration, m/s2; h – height photometrically pressure, which is equal to the height of air column or liquid, giving a pressure to the PCT on the contact surface equal to 1 m2.
2. Change of Flow Indicators for the Transport Line and Its Description
It is known that the dynamic pressure depends on density and air velocity, in the absence of vacuum (or exhaust) gas through the wall of the pipe (or pipe joints), i.e. the constancy of the speed of air, it does not change along the entire length of the pipeline and its possible to define the flow-rate measurement. And static pressure, assuming the density of known value that depends only on the height of the column of air, which is not determined instrumentally. This pressure is estimated a direct measurement at the beginning (the mouth) and the end (of the fan) of the pipeline. Judging by the formula, the static pressure depends on the height of the column of gas, which by its weight presses on the support surface, and this in turn is the distance that starts from the point where the pressure is minimum (or zero) value and continues to the point of contact pressure force with a supporting surface where it has maximum value. At a constant cross-section and resistance to duct static pressure from the mouth of the duct to the fan varies in a linear relationship.
Imagine the origin of coordinates R0L corresponds to the location of the fan (figure 1), where the axis OL is the length of the pipeline and the axis 0P - static pressure. For this case the equation of a line can be described as:
(Р-Рн) / (Рb- Pн) = (L – L0) / (Lb– L0), (4)
Where, PH is the initial or nominal pressure (i.e., pressure of the fan, which is equal to thecertifiedvalueof the pressure generated by the fan) Pa; Pb – the final pressure, or pressure at the mouth of the pipeline, Pa; L0 and Lb, respectively, the initial and finallength of pipeline, m. Imagine thatthecountdownstarts right at the fan and take L=L0=0, then the mouth of the pipe L=Lb. If, given these conditions, to solve the equation forR, we get:
P = (РbL+ Рн (Lb – L)) / Lb, (5)
Check: if L=0, P = PH; and when L= Lb, P =Pb. Hence, the equation correctly describes the law of variation of pressure along the transport line.
On the other hand, at the mouth of the pipeline pressure decreases to a pressure value of Рк is required to overcome the resistance of the pipeline:
Рк = 0.5 ρυ2λLb/d, (6)
Where, λ is the drag coefficient. Accordingly, the pressure atthe mouth of the pipeline willbe equal to:
Pb = Pн - 0.5 ρυ2λ Lb/d. (7)
If the equation to describe the relative static pressure, the pressure at any point on pneumotrack will be equal to:
Pст = Pнс - 0.5 ρυ2λ L/d, (8)
Here Pнс is the nominal static pressure (this is pressure, which can reach the fan with the nameplate capacity), Pa. And total pressure Pп according to (2),(3) and (8):
Pп = Pнп– 0.5 ρυ2(λ L/d– 1), (9)
Here, Pнп– full rated pressure of the passport is also the index fan Pa.
3. Analysis of Changes in Air Pressure Depending on the Flow Parameters
From equations (8) and (9) it is seen that the air pressure in any section of the pipeline depends on the nominal pressure fan negative pressure expended in overcoming the resistance of materialoved, which in turn is the length of the pipeline is directly proportionate to and from the diameter of the pipeline is in inversely proportional. The analysis of dependencies at different flow settings.
Internal diameter of the pipeline is equal to d= 0.315; 0.355; 0.4 m, the air density ρ= 1.2 kg/m3. The resistance coefficient for clean air for rough pipes is often determined by the formula of Shiferson [8]:
λ= 0.111 (а / d)0.25, (10)
Here a – coefficient of roughness of the pipe, which for the new pipes is equal to a = 0.133; used for pipes a = 0.044. With this in mind, for different pipe diameters:
| When а = 0.133 | When а = 0.044 | ||
| d = 0.315 m | λ=0. 089 | d = 0.315 m | λ=0. 068 |
| d = 0.355 m | λ=0.087 | d = 0.355 m | λ=0.066 |
| d = 0.4 m | λ=0.084 | d = 0.4 m | λ=0.064 |
Analysis of equation (9), conducted on a computer with different flow parameters are presented in fig. 2.
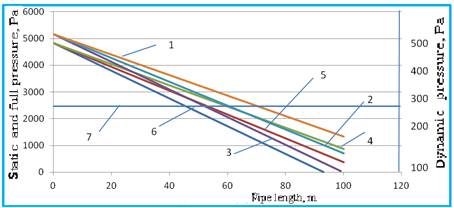
Fig. 2. Distribution of statically and dynamic pressure along the line of the pipe.
Photos 1, 2 and 3 - full line pressure, 4, 5 and 6 lines of static pressure and dynamic pressure line 7. At the same time, 1 and 4 - 400 mm pipe, 2 and 5 -355 mm pipe, 3 and 6 - 315 mm pipe.
The results show that the dynamic pressure under the condition of complete tightness of the system has a constant value along the line of current. And static and total pressure linearly decreases from the point of disturbance, i.e., from the fan to the extremities of pneumothrax. The figure shows that at smaller diameters the decrease in pressure more intense. This shows high resistance of pipes of a smaller size relatively large. For example, if pipe diameter 315 mm static and dynamic pressure approaching zero at a distance of 95 to 100 m. Important this time graphics of pressure when the diameter of 355 mm (2-line) and 400 mm (4-line) intersect and the values are very close to each other. This shows that replacement of the pipeline diameter 400 mm pipeline diameter 355 mm to large losses of pressure and power will not. According to this, the pipe diameter is 355 mm can successfully replace the pipes of 400 mm diameter.
4. Analysis of Changes in the Resistance Coefficient of the Inner Surface of the Pipeline from Its Diameter and Flow Rate
Indeed, many studies report an increase in the resistance of the pipeline with decreasing diameter of the pipeline. However, by Blasius [1] found that for hydraulically smooth tubes the increase in air velocity at constant diameter of the pipe reduces the resistance of the pipeline. They have the inversely proportional dependence of drag coefficient on Reynolds number:
λ= 0.3164 / Re0.25, (11)
In turn, the Reynolds number is defined as the product of duct diameter and air velocity:
Re =ρdʋ/µ.
Here µ - the coefficient of dynamic viscosity of air (1.85•10-5 Pa•s). The results of the analysis of (13) are presented in table1.
Table 1. The dependence of the aerodynamic drag from air velocity and duct diameter.
| D, м | λ at different air velocities | |||||
| v=15 м/c | v=15 м/c | v=15 м/c | ||||
| λb | λe | λb | λe | λb | λe | |
| 0.400 | 0.0127 | 0.022 | 0.0118 | 0.0206 | 0.007 | 0.019 |
| 0.355 | 0.0130 | 0.023 | 0.0120 | 0.0216 | 0.0115 | 0.020 |
| 0.315 | 0.0135 | 0.024 | 0.0125 | 0.022 | 0.0118 | 0.0216 |
In the table, λb is the drag coefficient for the Blasius; λeis the experimental drag coefficient. If you pay attention to the results of the analysis can be seen that the decrease in pipe diameter leads to an increase in resistance and increase in flow velocity to decrease. In addition, the experimental results under odds on Shiferson, more of the coefficients for the Blasius. In this case, the experimental drag coefficient λe are determined according to the equation:
λ= (0.5 ρυ2+Pн– Pп) d / (0.5 Lρυ2), (12)
If the pipeline is made of steel sheets with a polished work surface or at a certain time was in operation, then the calculations can use coefficients Blasius. In other cases, you can use the experimental factors. And if the pipeline is made of untreated steel sheets, with a high degree of roughness, then the calculations can use coefficients Shifersona. From the analysis results show that the coefficient of resistance decreases with increasing air velocity. hence we can conclude that in fact, the increase in resistance of the pipeline with smaller diameters can be compensated by increasing the flow rate [9], [10], [11]. This showsthe possibility of the successful use of pipesdiameter 355 and 315mm inpressure pneumatic conveyinginstallationfor raw cotton.
5. Conclusions
1). Theoretical studies have shown and proved the reduction in static and full pressure on the line of transportation.
2). The dependence of pressure change on the transport line diameter and aerodynamic resistance of the pipeline.
3). The obtained results are recommended to apply when designing pneumatic conveying systems for raw cotton.
References


