| 1. | ||
| 2. | ||
| 2.1. | ||
| 2.2. | ||
| 3. | ||
| 4. | ||
Dry Micro-frictional Properties of Ceramic and Polystyrene Oscillating Against a Sapphire Counterbody at Small-Scale Loads
Mohammad S. Alsoufi
Mechanical Engineering Department, College of Engineering and Islamic Architecture, Umm Al-Qura University, Makkah, KSA
Email address

Citation
Mohammad S. Alsoufi. Dry Micro-frictional Properties of Ceramic and Polystyrene Oscillating Against a Sapphire Counterbody at Small-Scale Loads. Engineering and Technology. Vol. 3, No. 5, 2016, pp. 100-105.
Abstract
In this paper, motivated by macro- as well as micro-systems applications, micro-scale friction properties tests were performed using a ball-on-flat arrangement under sliding precision motion. Friction force, Ff, and coefficient of friction (CoF) were measured with the applied normal load ranging from 5 mN to 50 mN, for ceramic and polystyrene samples. A 1 mm diameter sapphire ball was used as a counterbody. Each test was conducted for approximately 15 minutes. Tests were repeated at least more than three times and the average values of friction force and coefficient of friction were plotted in order to ensure the reproducibility of the results. Friction-load curves suggest that, for applied normal loads in the regime of milli-Newton, two properties have a strong influence on the micro-friction, which is the adhesive force and surface energy. Also, it is shown that CoF ranging from ~0.195 (at 5 mN) to less than ~0.125 (at 50 mN) (for ceramic) and from ~0.135 (at 5 mN) to less than ~0.085 (at 50 mN) (for polystyrene) in ambient condition can be achieved. So, that means some applications at micro- and nano-scale size can live over a longer period of time and increase their tolerances.
Keywords
Small-Scale, Ball-on-Flat, Friction Force, Coefficient of Friction (CoF)
1. Introduction
Micro- and Nano-friction plays a prominent role in a variety of industrial processes and diverse systems. Due to this, a fundamental understanding of friction is therefore crucial for many emerging fields [1,2]. With the miniaturization technology of moving components in various technological devices for instance robots, bio-medical implants, read and write heads [3], Micro-Electro-Mechanical Systems (MEMS) [4,5] and Nano-Electro-Mechanical Systems (NEMS) [6]. Over almost all scales of size, from macro-scale to micro- and nano-scale, friction behaviour can have both positive and/or negative effects, depending on the application [7,8]. Besides, at these scales of sizes, volume and mass drop rapidly as L3, beam stiffness drops less rapidly as L. Therefore, natural frequency increases as L-1. Also, inertia drops rapidly so devices become more vulnerable to, e.g. Brownian motion, and the cube square law as scale reduces, surface effects, e.g. electrostatics, tends to dominate volume as well, e.g. magnetics. Keeping this in mind, it is well-known that friction behaviour is defined as Amonton’s laws in the macro-scale. The frictional force, Ff, is proportional to the normal load, FN, i.e., Ff = µFN, and the coefficient of friction, CoF, µ, is independent of the normal load and the contact area of asperities [9]. But, in micro- and nano-scales including those using micro-structures in MEMS/NEMS applications show that Amonton’s laws cannot be used successfully due to adhesive forces which might remain and friction behaviour between two contact areas that will persevere [10].
The relative motion of two bodies without medium (of such sphere-flat contact) at close proximity induces non-conservative force, which counteracts the motion and thus gives rise to the loss of mechanical energy by converting it into internal energy or heat. This phenomenon is called "friction". In micro- and nano-scale contacts, friction is investigated on the scale length of micrometres to nanometers and the force range of milli-Newtons to nano-Newtons. As a result, friction is more influenced by the surface properties than in the case of macroscopic systems. Therefore, different behaviours and mechanisms or at least different relative importance of mechanisms in macroscopic systems apply when moving to the micro- or nano-scale. Then, the friction force, Ff, is often expressed as shown in Equation (1) [11]:
![]() (1)
(1)
where, Fadh, is the force due to adhesive interaction at the contacting body surfaces, Fwear, is the force due to wear at the interface of contacting body surfaces, and Fstick-slip, is the force due to stick-slip between contacting body surfaces.
In this paper, the objective is to discern differences in dry micro-frictional of different materials sliding against a sapphire counterbody ball at milli-Newtown loads and to link these differences to the properties of the tribo-systems.
2. Experimental Details
2.1. Sample Selection
In this study, two materials: namely (ceramic: aluminium oxide, Al2O3) and (polymer: polystyrene, PS) were investigated with identical dimensions of length of 15 × 15 × 3 mm. The counterbody was a sapphire ball, which has been determined to be around 1 mm diameter. Figure 1 shows the samples to be tested and the counterbody used in this investigation. The extraordinary properties of aluminium oxide (Al2O3) materials make them particularly well-suited for micro-friction and nano-friction applications. These characteristics include high value in terms of hardness, high resistance to corrosion, dimensional stability, a low coefficient of thermal expansion [12], very stable, low reactivity, good chemical-resistance and high temperature resistant [13-15]. On the other hand, polystyrene (PS) is a thermos-plastic polymer material that possesses a great many advantages. It can be easily recycled, synthesized chemically and processed conveniently. It is moderately resistant to thermal degradation and it shows high toughness and stiffness values. Also, its optical transparency makes PS attractive for a great deal of applications for example insulation and packaging [16].
Prior to performing each test series, both samples (ceramic and polystyrene) and sapphire ball were cleaned for approximately 15 minutes each using an ultrasonic cleaning bath first in acetone (C3H6O), then in isopropyl alcohol (C3H7OH) and lastly in ethyl alcohol (C2H5OH). It should be noted that the entire load-test performing series was accomplished without any intermediate lubricant on the samples surface.
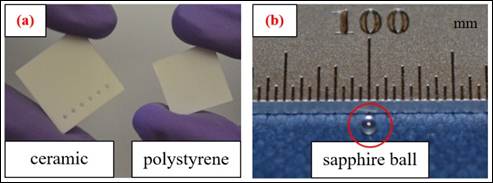
Figure 1. (a) samples to be tested and (b) the counterbody.
2.2. Micro-Friction Procedure
Testing was conducted using a unique design of a new generation of micro-friction (BASALT®, Precision Test-rig, TETRA). The main reason for using this high-precision test-rig, where all the repeatability performance of the friction measurements is achieved at low loads (from µN to mN regimes), is that measurements are made under low-wear or even wear-less conditions. The test-rig contains of three crucial elements: (1) high-precision motion mechanisms, (2) a cantilever beam (force transducer double leaf spring, typically 1 cm length and 100 µm width) and (3) fiber-optic sensors technology (Tetra GmbH, Germany) to detect the normal deflection, ∆z, and lateral deflection, ∆x, of the force transducer system. There are several drives systems incorporated within the precision test-rig for positioning the samples and the 1 mm diameter sapphire ball (Grade P, Batch No. D51050, +0.06 µm surface roughness), provides oscillating motion and normal force adjustment. The positioning units serve to position the sample in the x-axis and y-axis, or the counterbody mounted on the bending element in the z-axis, respectively. These motions are achieved using stepper motors with a resolution of ±2.5 µm. The motion range from the initial position is 10 cm in the x-axis and y-axis, and 5 cm in the z-axis. The oscillation motion of the sample is realized by using linear bearing which is connected to a piezo-electric transducer powered by a low voltage amplifier (-10 V to 150 V). The fixed end of this flexes back and forth in the x-axis and either pushes or pulls the linear bearing. Thus, an oscillation motion in the range of ±0.5 mm is achieved. The 1 mm diameter ball was glued to the double leaf spring system and the sample to be tested was mounted using suitable adhesive on the top of a sample holder that is fixed to the linear bearing assembly. For more details, see [17].
The tests were carried out under fundamentally wear-free conditions with normal loads of 5, 10, 15, 20, 25, 30, 35, 40, 45 and 50 mN (using a Wheatstone bridge strain gauge load cells mV/V output), 125 µm/s sliding velocity, 0.21 Hz frequency, 300 µm stroke length, with an ambient temperature of 20±1°C and a relative humidity of greater than 40±5% RH, 15-cycles small oscillation amplitude and the steel double leaf spring constant were kN = 608 ± 26 N/m and kL = 993 ± 28 N/m. Once the 15-cycles was completed, the oscillation motion was stopped, the 1 mm counterbody ball lifted from the sample surface to be tested and moved to new randomly located regions on the sample surface at least 300 µm from the previous one. What was measured was then repeated again with a higher normal load until the maximum normal load, which is 50 mN, was reached. By fitting these data according to an appropriate contact or friction model, the friction force, Ff, and coefficient of friction, CoF, can be determined from such curves.
Here, Figure 2(a) shows the small oscillation amplitude during which time the friction force, Ff, was continuously recorded with a ball-on-flat contact arrangement. Figure 2(b) demonstrates the interaction of two homogeneous surfaces with multi-asperity contact in micro-scale, whereas Figure 2(c) shows the single-asperity contact at nano-scale. Depending on the height of these asperities (peak and valley), the total sum of the normal load is indeed distributed over the asperity pairs (peak and valley) as F1N, F2N, F3N, …, FiN, where i = 1, 2, 3, …, n. So, the whole tangential load recorded is the sum of the resistance load at each asperity pair. Figure 3 shows two different friction plots versus time and the principle of force detection in the test-rig. Figure 3(a) shows a typical graph for reciprocating movement, on the other hand Figure 3(b) demonstrates that the testing conditions and cantilever beam system choice are incompatible as the stiffness is relatively low in the lateral axis, XL, and the sample to be tested cannot track the imposed movement properly.
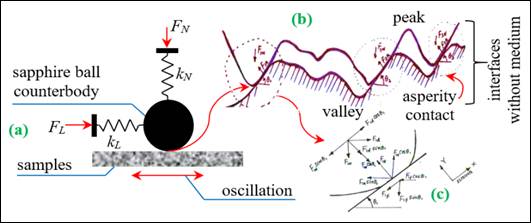
Figure 2. (a) Schematic ball-on-flat contact arrangement, (b) multi-asperity contact and (c) single-asperity contact, adapted from [18,19].
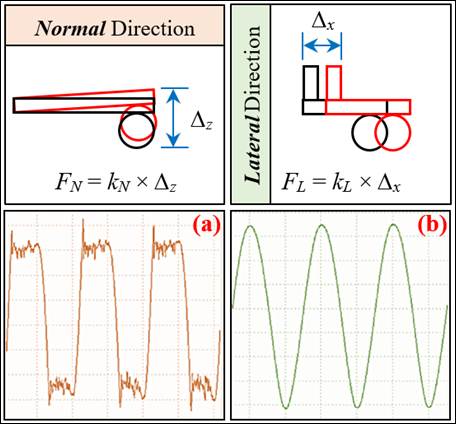
Figure 3. Friction vs. time in small amplitude with principle of detection, (a) typical graph for oscillation in normal direction and (b) testing conditions and cantilever beam system choice are incompatible as the stiffness is relatively low in lateral axis, adapted from [20,21].
3. Results and Discussions
The friction force, Ff, and the coefficient of friction, CoF, in unlubricated contacts were studied under the ambient condition using the universal surface tester and nearly-wear conditions. The friction force, Ff, values were determined during the test as a function of the normal load on both samples (ceramic and polystyrene) to generate friction-load curves, as shown in Figures 4 and 5, with a strong linear relationship of R2 > 0.99, providing useful information about the micro-frictional behaviour of the systems. The coefficient of friction, µ, was recorded in both samples as shown in Figures 6 and 7. The normal load chosen for these tests was well below the load where the onset of observer wear (plastic deformation of asperities and shearing of deformed material) was found to occur for the different structures in the wear mapping tests. As can be seen in Figures 4 and 5, the friction forces, Ff, increase on raising the normal load on both tested surfaces. So, a linear dependence is observed. It is widely known that the friction force is proportional to the normal load (which is in agreement with the first law of friction, Ff = µFN [22] and is similar to the outcomes described for measurements in single-asperity contact [23] and multi-asperity contact [24]). Differences in friction forces between the ceramic and polystyrene surfaces were observed. Higher friction force was measured on the ceramic: aluminium oxide, Al2O3 sample, whereas lower friction force was obtained on the polymer: polystyrene (PS) sample when the sapphire ball was oscillating against both samples. This is why the frictional properties behaviour in micro-scale regimes can be more easily affected by the surface modifications and normal loads, and more widely scattered than that in macro-scale regimes. Besides, the adhesive force (the force due to adhesive interaction at the contacting surfaces) inherently contributes to the friction force, Ff. Also, it acts as an extra normal load and increases the friction force, Ff, which constitutes consistent results in line with the following references [25-27]. Also, the result agrees with other micro-frictional studies using a sapphire ball as a counterbody [28].
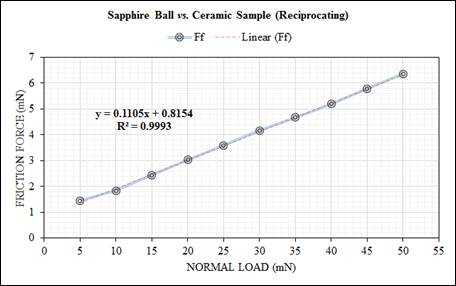
Figure 4. Friction force vs. normal load for the sapphire ball (Ø1 mm) oscillating against the ceramic sample. The solid (blue) line has been drawn to guide the eye.
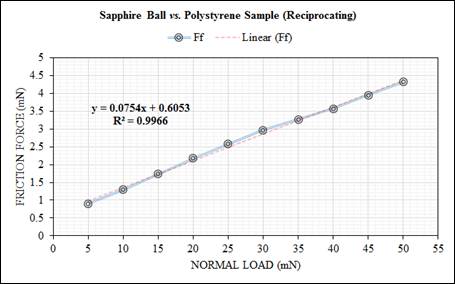
Figure 5. Friction force vs. normal load for the sapphire ball (Ø1 mm) oscillating against polystyrene sample. The solid (blue) line has been drawn to guide the eye.
The coefficient of friction, µ, stated as the traction (adhesive friction or force) divided by the perpendicular (normal) applied load is, as a result of this condition, predicted to exhibit some interesting phenomenon. At reasonably high normal load, the effect of surface energy (also known as surface free energy) might be neglected, and the contact area will be inversely proportional quantities to the cube root of the normal load, with the intention of the CoF value will tend asymptotically towards zero as the normal load increases. On the contrary, as the normal load decreases, the ball/sample contact area will tend to a finite value which at zero normal load becomes as expressed in Equation (2):
![]() (2)
(2)
where, a, is the Hertzian contact radius, γ, is the surface energy value for a solid-solid interface, k, is the combined elastic constant of interface and given as shown in Equation (3):
![]() (3)
(3)
It is evident that, as the normal load decreases to zero, the CoF value will asymptotically tend toward positive infinity. There is a singularity about this zero point, after which the CoF value asymptotically decreases from negative infinity to zero point at a sensible load given by ![]() , after which the sample to be tested will decohere from the counterbody. But, it should be noted that, at these scale-levels, the CoF value loses its traditional meaning and it is perhaps more suitable to use molecular models; see for instance, Landman et al. [29].
, after which the sample to be tested will decohere from the counterbody. But, it should be noted that, at these scale-levels, the CoF value loses its traditional meaning and it is perhaps more suitable to use molecular models; see for instance, Landman et al. [29].
The CoF value was also calculated as a slope from the plots of friction force, Ff, data versus the normal load obtained from Figures 4 and 5. Based on the coefficient of friction, µ, values depicted in Figures 6 and 7, it is assumed that the system is operating in unlubricated regime with a stable polynomial regression relationship of R2 > 0.99. It reveals that the coefficient of friction (CoF) of all sliding combinations decreases with the increasing of the normal load for dry friction conditions. Apparently, the CoF for a sapphire ball sliding against ceramic sample represents a slightly higher value ranging from ~0.195 at 5 mN to ~0.125 at 50 mN, whereas, the CoF for a sapphire ball sliding against a polystyrene sample represents very little value ranging from ~0.135 at 5 mN down to ~0.085 at 50 mN. The CoF value may be very low for very smooth surfaces and/or at loads down to micro-Newton and nano-Newton range. Wide variability is typically seen in reported value of µ for both samples and it would therefore be misleading to state even representative CoF for particular materials. Environmental factors are responsible for a good part of this variation. Besides, Al2O3 (oxide ceramic) tends to react with atmospheric moisture to form hydrated surface layers with low shear strength. Moreover, the ductility at asperity contacts of ceramic is much less than of metals, so that µ is generally lower, as expected. Also, because the yield stress is high, contact is often predominantly elastic. Of interest is the fact that similar behaviour has been observed by other researchers [22,30,32]. Based on the experimental results, the theoretical fit according to Hertzian theory can be written as in Equation (4) [33]:
![]() (4)
(4)
where, ![]() , is a pressure independent shear constant and
, is a pressure independent shear constant and ![]() , is the pressure sensitivity of the shear strength [34].
, is the pressure sensitivity of the shear strength [34]. ![]() , is the elastic modulus,
, is the elastic modulus, ![]() , is the radius of the specimen, and
, is the radius of the specimen, and ![]() , is the normal load. The curve does not precisely follow the
, is the normal load. The curve does not precisely follow the ![]() law, nevertheless is close to an inverse law (best fit) [33]. Indeed, these graphs indicated two very significant trends; (1) as the normal load increases, the CoF asymptotically tends towards the relative Amonton-Coulomb friction laws and (2) although the surface energy (surface free energy) has slight effect at higher normal loads, there is a marked increase in the CoF value as the normal load decreases. As a result, it can be assumed that the CoF value at high normal load is a function of the apparent normal load and shear stress, while at low values of CoF this is dominated by the surface energy and certainly it plays a critical role on determining the level of friction properties.
law, nevertheless is close to an inverse law (best fit) [33]. Indeed, these graphs indicated two very significant trends; (1) as the normal load increases, the CoF asymptotically tends towards the relative Amonton-Coulomb friction laws and (2) although the surface energy (surface free energy) has slight effect at higher normal loads, there is a marked increase in the CoF value as the normal load decreases. As a result, it can be assumed that the CoF value at high normal load is a function of the apparent normal load and shear stress, while at low values of CoF this is dominated by the surface energy and certainly it plays a critical role on determining the level of friction properties.
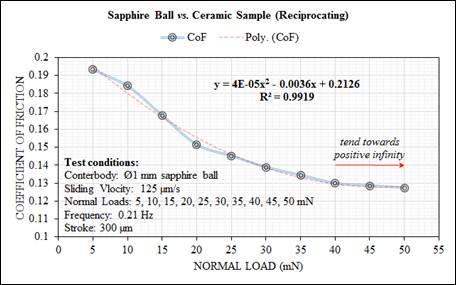
Figure 6. CoF vs. normal load for the sapphire ball (Ø1 mm) reciprocating against the ceramic sample. The solid (blue) line has been drawn to guide the eye.
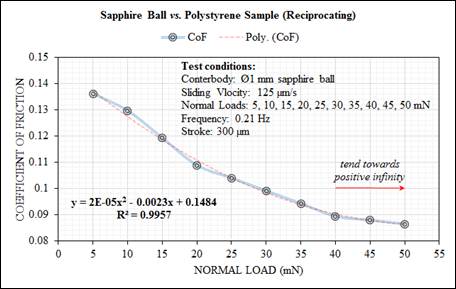
Figure 7. CoF vs. normal load for the sapphire ball (Ø1 mm) reciprocating against polystyrene sample. The solid (blue) line has been drawn to guide the eye.
4. Conclusions
Friction properties phenomena present challenges and indeed opportunities for micro- and nano-systems, especially in dry friction conditions where lubricants cannot be used. A comparative investigation of the micro-frictional properties of ceramic and polystyrene materials was presented using ball-on-flat arrangement with high repeatability and reproducibility of the results. From the work presented here, the following conclusions can be drawn:
Ÿ The friction force, Ff, for both samples (ceramic and polystyrene) increases linearly when increasing the normal load for multi-asperities contacts, and the increase of the friction force is more pronounced on the ceramic surface when sliding against a sapphire ball.
Ÿ The coefficient of friction (CoF) for both samples (ceramic and polystyrene) decreases when increasing the normal load. The CoF of polystyrene sliding against sapphire ball shows the lower value of µ ~ 0.085 at 50 mN, whereas the CoF of the ceramic sample shows a slightly higher value of µ ~ 0.135 at the same load.
Ÿ The slope for both samples (ceramic and polystyrene) showed the strong linear relationship of R2 > 0.99 with 95% level of confidence, providing useful information about the micro-frictional behaviour of the systems.
From the above discussions, in micro-frictional studies, the contact area (ball/sample) is diminished compared to macro-frictional tests. Thus, the frictional properties generated in the interface becomes increasingly sensitive to surface effects and low-range normal loads, such as adhesive force characteristics and wear behaviour. This leads to an increased friction force, which in turn decreases the CoF in (ceramic: aluminium oxide, Al2O3) and (polymer: polystyrene, PS) samples. So, in sum, these materials have enormous potential in the field of micro-mechanism and nano-technology.
References


