| 1. | ||
| 2. | ||
| 3. | ||
| 3.1. | ||
| 3.2. | ||
| 3.3. | ||
| 3.4. | ||
| 4. | ||
Petrophysical Properties of Clastic Reservoirs Using NMR Relaxometry and Mercury Injection Data: Bahariya Formation, Egypt
Abdel Moktader A. El Sayed1, Nahla A. El Sayed2
1Department of Geophysics, Ain Shams University, Cairo, Egypt
2Egyptian Petroleum Institute, Nasr City, Cairo, Egypt
Email address
 (A. M. A. El Sayed)
 Citation
Abdel Moktader A. El Sayed, Nahla A. El Sayed. Petrophysical Properties of Clastic Reservoirs Using NMR Relaxometry and Mercury Injection Data: Bahariya Formation, Egypt. International Journal of Geophysics and Geochemistry. Vol. 3, No. 3, 2016, pp. 28-32.
Abstract
The Bahariya Formation in the Western Desert of Egypt is a sedimentary sequence which was deposited under fluvial to shallow marine conditions at the beginning of the Upper Cretaceous (Cenomanian) transgression. Nuclear magnetic resonance (NMR) measurements have been carried out in 30 sandstone core samples, obtained from this formation. The estimated transverse relaxation times (T2) fall in the interval of 100 µs and 600. µs. Application of a model related core-porosity and (T2) measured from NMR spectrum have allowed determination of the cementation exponent of Wyllie’s type with high accuracy. Consequently, it is possible to enhance in the determination of the water saturation and hydrocarbon saturation. The irreducible water saturation (Swirr) calculated from the mercury injection capillary pressure (MICP) measurements is found to be related to the normalized area under < 4 µs of (T2). Use of a regression model with a reliable coefficient of correlation has permitting calculation of (Swirr) with high accuracy. The natures of lithologic laminations present in some intervals of the Bahariya Formation have been examined using both measurements of (MICP) and (T2). Thin sections and SEM-micrographs were made for some selected core samples in order to recognize petrography and mineralogy of the Bahariya sandstones. Glauconitic, mica, zircon, rutile and pyrite minerals are found to be predominant in the laminated sandstone intervals.
Keywords
Bahariya Formation, NMR Relaxometry, Capillary Pressure, Irreducible Water Saturation, Egypt
1. Introduction
The Bahariya Formation in the Western Desert of Egypt is a sedimentary sequence which was most likely deposited in a Tidal flat - lagoon environment at the beginning of the Upper Cretaceous (Cenomanian) transgression in the Western Desert of Egypt. Barrier bar, stream mouth bar, point bar, and distributary channel sand bodies were detected in the Bahariya Formation encountered in the Salam and Khalda oil fields [1]. Poison’s ratio and fluid saturation relations have been investigated by [2]. Bahariya Formation is often considered as the most important hydrocarbon reservoirs in the Western Desert. Thus, a better understanding of the Petrological and petrophysical characteristics of the Bahariya reservoir sandstones is considered useful [3].
The samples of fine-grained sandstones of Bahariya formation display large numbers of black lamination or flaser bedding. As illustrated in Figure (1) these are parallel or perpendicular to the sedimentary strata and partly embedded particles. The petrology and some petrophysical properties of the Bahariya core samples have been studied by many authors [4, 5, and 6].
[7] Introduced a novel cementation exponent (mNMR) prediction model, which is relevant to spectral study of porosity (Ø, %) and NMR transverse relaxation time (T2LM, % of total area). Based on the analysis of the core test results of [7]. They established a regression model as;
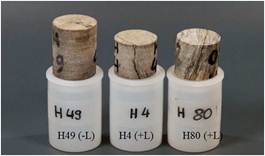
Figure 1. Fine grained Bahariya sandstone plugs illustrating different degrees of flaser lamination (+L = parallel or perpendicular to bedding plane, - L = non-laminated).
mNMR = {(-1.262-(0.047 Ln T2LM)) / Ln Ø} - 0.905 R2=0.91 (1)
In the above equation, R2 refer to the coefficient of determination. The high value of R2implies that the value of correlation coefficient (R) in equation (1) is close to 1.0, which indicates that the cementation exponent (m) can be calculated from NMR logs precisely. This model has been tested in the present work and the results obtained have been considered as supporting its applicability. The T2 values for both the Bahariya (Egypt) and Szolnok (Hungary) sandstone reservoirs >33 ms [8] and reach up to 600 ms. Application of this model has improved the accuracy of water saturation value which in turn has allowed improved estimates of, hydrocarbon saturation. The irreducible water saturation (Swirr) values calculated from mercury injection capillary pressure (MICP) results are assumed to be function of the clay bound water (CBW) determined from the T2-distribution curve (for T2 < 4.0 ms). The value of bulk volume irreducible (BVI) or capillary bound water (1-5ms) is related to the magnetic susceptibility (k) for the Bahariya laminated and non-laminated samples [6] and represented by relations of the type;
Ln k = 2.604*BVI+2.585 (for laminated sandstones) R2 = 0.42 (2)
Ln k = 3.458*BVI + 1.834 (for non-laminated sandstones) R2 = 0.62 (3)
The cut-off (CBW/BVI) depends mainly on clay minerals presented in pore spaces. It is 33ms for clastics and 90 ms for carbonates. The target of the present research work is to delineate interrelations among some sandstone reservoir derived parameters from NMR measurements. The same parameters may also be derived from mercury injection capillary pressure (MICP) tool or laboratory conventional tests like porosity. In addition, the effect of core sample orientation (horizontal or vertical relative to the formation bedding plane) on the T2- frequency distribution curve-shape was objective as well.
2. Methodology
The studied samples were cleaned using Sohxlet extractor (mixed with different organic solvents) prior to measurements of porosity by NMR and MICP methods. The samples were dried in an electric oven and then weighted using digital balance with precision of 0.0001g. Porometer-2000 was used in MICP test. The (MICP) curve illustrates the variation of pressures with injection volume in 30 samples. The measurements are roughly logarithmically spaced between <5.0 psi to >30kpsi air/mercury pressures. For the purpose of comparing NMR and MICP data, mercury capillary pressure Pc (in psi) was converted to pore radii (r, in μm) using Washburn equation;
r = 0.29 ϭ cos ϴ/pc (4)
Where the interfacial tension ϭ has the value of 480 dyne/cm and contact angle ϴ is 140°.
The samples were then vacuum and saturated with NaCl brine where the concentration was adjusted to approximate the formation water salinity of the Bahariya Formation penetrated in Bed-1 field (0.56 g/l). Proton NMR measurements were made for all studied samples at 100% brine saturation. T2 measurements were made in a homogeneous magnetic field using Carr-Purcell-Meiboom-Gill (CPMG) method with phase alteration and an inter-echo spacing (IES) of 0.5 ms. A sufficient number of echo trains were measured and stacked to achieve a minimum signal- to – noise ratio of 200:1 (typically 300:1). T2-distributions were computed by fitting the stacked echo trains for partial porosity amplitudes corresponding to 51 per cent of selected values of T2 (spaced logarithmically between 0.1 and 10,000 msec). Using the algorithm developed by [9] in order to place all distributions on a common scale, MICP pore radii were converted to an equivalent T2 value according to equation proposed by [10];
(1/T2) = (Vpore / T2 bulk) +(ls / T2 Surface) = ρе (S/V) (5)
Where ρе is the effective surface relaxivity in μm/sec.; Vpore is the rock pore volume in cm3, T2bulk = is value of T2 for bulk sample; S = is sample surface area, cm2. Then for cylindrical tube pores, the surface to volume ratio (S/V) equals (2/r), and substituting this in equation (5) we have:
T2 = ((1000 r) / 2ρе) (6)
Where, 1000 is the conversion factor adopted by [10] in order to correlate MICP with NMR data. He added that the average value of specific relaxivity (ρе) for clean sandstone is 14.0 and for shale sandstone it is 16.0, while it is 9.5 for carbonate facies. In the present work, the value of (ρе) is assumed to be 15.0 for the studied sandstone samples of both the Bahariya and the Szolnok formations [5, 8, 11 and 12]. The Pore radius (RNMR) in the present study, is calculated using equation (6), while the cementation exponent (mNMR) is calculated using equation (1).
3. Results and Discussion
3.1. Change of T2 – Spectra with Sample Lamination
The spectra of T2 – distributions curve shape change with the density of the flaser lamination, from horizontal direction of sample cutting into vertical (Fig. 2a). Changes of sinuosity and number of population are increases between horizontal (parallel to the bedding plane) and vertical (perpendicular to the bedding plan) with increasing lamination (Figs. 2a and b). This change in the T2-distribution curve-shape indicates T2-anisotropy shown in positive laminated sandstone samples obtained from the Bahariya Formation, while sandstone of Szolnok Formation exhibits non- lamination and relatively clean from shale [8, 11 and 12]. The changes in the T2 frequency distribution curve indicate more than one physical population inside the sample under investigation (sample - 75V). This could be explained by tight laminas of small pore sizes beside larger pores. While, sample - 75H, shows almost normal distribution curve for only one population. Also it is a function of the sample anisotropy. Samples - 49H and 49V are identical in the T2- frequency curve shape indicating homogeneity in the rock architecture not only in pore space framework but also in mineral composition, primary structures and rock fabric (Fig. 2b). The study of T2 –frequency distribution curve shape could be used in deltaic rock genetic type’s discrimination which improve oil and gas exploration techniques.
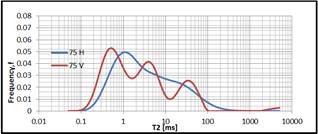
Figure 2a. T2-Distributionof samples 75H (+L) and 75 V (+L).

Figure 2b. T2-Distributionof samples 49H (-L) and 49 V (-L).
3.2. NMR Porosity versus Conventional Porosity and CBW
Porosity measured by saturation method has been related to its synonymous NMR porosity (Fig. 3). This relationship shows close correlation (with correlation coefficient of 0.973 for Bahariya samples from Egypt and 0.985 for Szolnok samples from Hungary) for the two types of sandstone reservoirs. These relations prove that porosity from NMR-logs is analogous for porosity calculated from core analysis tests. The NMR-porosity is related to the clay bound water (CBW) calculated from the relaxation time (T2) and considered as a function of area percentages from the total area under T2 – spectra, for times < 4ms (Fig. 4).
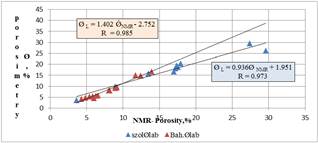
Figure 3. Lab. Porosity versus NMR-Porosity.
The high values of correlation coefficient permit the prediction of clay bound water (Irreducible water saturation) using rock porosity either calculated either from conventional core analysis or NMR-tools. These relations are illustrated in Figure (4). The corresponding regression line equations are:
CBW = -3.431Ø+97.94 R=0.90 (for clean non-laminated sandstones) (7)
CBW = -2.132Ø+72.92 R=0.877 (for shale and/or laminated sandstone) (8)
Figure (4) elucidates that we have two different trends each of which represent a certain type of sandstone. They are completely different in geologic age, porosity, permeability, cement mineralogy and also in irreducible water saturation, but they are similar in their depositional environment in a broad manner. Two of them are deltaic sandstone. The most importance of such relationship is to calculate the clay bound water (clay content, %) from the rock porosity, which is considered as routine laboratory measurements.
3.3. Porosity Versus Cementation Exponent
Using equation (1) derived by [7], the cementation exponent (m) is calculated and related to rock porosity (Fig. 5). Two sandstone types (Bahariya and Szolnok) were considered. Most of the Bahariya sandstone is rich in shale and laminated while, Szolnok sandstone is relatively cleaned, non-laminated and of high porosity. The relationships illustrated in Figure (5), are very close and characterized by relatively high coefficient of correlations (R = 0.71 and 0.76 for Bahariya and Szolnok respectively). They are;
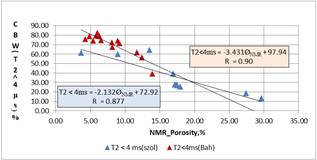
Figure 4. Clay bound water (CBW), % versus NMR-Porosity (red points for Szolnok sandstone and blue points for Bahariya samples).
m = 0.052Ø +0.82 (9)
m = 0.514 ln (Ø) +0.084 (10)
Equations (9 and 10) are useful for cementation exponent determination for relatively clean and/or shale rich sandstone formations especially in case of the lake of core samples.
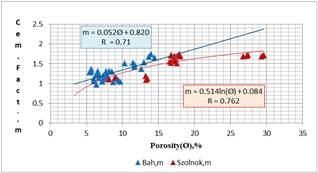
Figure 5. Wyllie’s Cementation Exponent versus Porosity for both Bahariya (blue) and Szolnok (red) formations.
3.4. CBW Versus Swirr
An attempt was made to relate the data of irreducible water saturation, calculated from MICP, to the T2 < 4ms% of the total area under T2-spectra (Fig. 6). The coefficient of correlation (R = 0.801) calculated for this relation indicate that regression line equation is very useful to delineate the irreducible water saturation from NMR- logs, it may be written as;
T2 = 62.7 ln (Swirr) – 126.8 (11)
R = 0.801,
Where: (Swirr), % is irreducible water saturation and T2 < 4ms% of the total area under T2- spectrum.
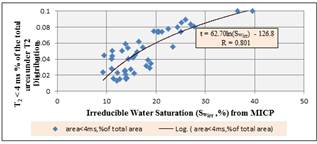
Figure 6. Relationship between Swirr, %( calculated from MICP) versus Clay Bound Water (CBW) calculated from NMR.
4. Conclusions
1. Cementation exponent (m) increases with porosity increasing and it could be outlined with high precision from either conventional or log porosity using equations (9 and 10) for shale – rich, laminated and clean sandstones respectively.
2. The Irreducible water saturation (Swirr) can be calculated from NMR-tools with high accuracy using the empirical equation (11), and from porosity using equations (7 and 8).
3. Clay bound water (CBW) can be calculated from porosity for shale rich or clean sandstone by using equations (7 - for clean and 8 - for shale-rich sandstone), while Capillary bound water (BVI) could be outlined from magnetic susceptibility using equations (2 and 3) for shale rich and clean sandstone respectively.
4. The T2- frequency distribution curve shapes depend on several parameters. one of the most important is the sandstone anisotropy including pore space framework, mineralogy, cementing materials and rock architecture as well.
Acknowledgements
Authors acknowledge Professor Jung Reinhardt of Leibniz Institute for Applied Geophysics (LIAG), Hannover – Germany for his encouragements, fruitful discussions and laboratory facilities introduced during DAAD fellowship of the first author. The fund of DAAD organization is greatly acknowledged.
References


