| 1. | ||
| 2. | ||
| 3. | ||
| 4. | ||
| 5. | ||
| 6. | ||
A Mathematical Model and Computational Experiment for the Study and Forecast of the Concentration of Harmful Substances in the Atmosphere
Daler Sharipov
Institute of Mathematics, National University of Uzbekistan, Tashkent, Uzbekistan
Email address

Citation
Daler Sharipov. A Mathematical Model and Computational Experiment for the Study and Forecast of the Concentration of Harmful Substances in the Atmosphere. American Journal of Computation, Communication and Control. Vol. 2, No. 6, 2016, pp. 48-54.
Abstract
This article covers a survey devoted to the problem of studying and forecasting the diffusion of harmful substances in the atmosphere. The authors have developed a mathematical model that takes into account wind speed and other weather and climate factors. Numerical experiments were conducted based on the given model. The obtained results presented here show the main factors that significantly affect the diffusion of harmful substances in the atmosphere.
Keywords
Mathematical Model, Numerical Algorithm, Harmful Substances, Weather and Climate Factor, Concentration
1. Introduction
An intensive growth of production and the expansion of transport systems in the world have considerable influence on the ecological condition of the environment. This is particularly evident for developing countries which are distinctive by a high rate of establishing new production facilities. The increase of harmful substances emission into the atmosphere inevitably involves an imbalance in the ecological condition of industrial regions with possible climatic changes.
In this respect, such issues as the assessment of air pollution and contamination of underlying surface by passive and active aerosol emissions, the deployment of new industrial facilities in compliance with sanitary norms, the determination of intensity and level of air and water pollution and the influence of emissions on flora and fauna are relevant in environment protection problem. And not only for individual regions, but also worldwide.
However, the restrictive conservation measures should not adversely affect the economic and industrial growth that makes the environment protection problem very actual and requiring accurately weighed decisions.
2. Related Works
There are numerous studies conducted in this scientific area. Many researchers worldwide have already obtained significant theoretical and applied results.
Reference [1] shows the carried study on the basis of the regional model of the process of substances diffusion described by hydro-thermodynamic equation the equation of molecular heat conduction in the active layer of the soil and the atmosphere, taking into account the heat balance of the underlying surface (water, earth).
The process of spread of harmful substances in the atmosphere, taking into account different climatic factors and external disturbances was given in [2]. The authors examined the transfer of pollutants from the source based on the advection of pollutants in the average air flow, mixing of pollutants by atmospheric turbulence and mass diffusion. The studied process was considered with a variety of physical and mathematical aspects related to the transport and diffusion of pollutants in the atmospheric surface layer when there are weak and strong winds.
The question of mathematical modelling of pollutants spread in aquatic environment induces certain interest. In [3] there was considered the process of spread of harmful substances into the environment, which had been modeled as a set of four simple models: overland water flow, seepage, pollutants transport by runoff and deposition of pollutants (accumulation) on the ground. The developed mathematical model of transport and diffusion of pollutants in the atmosphere rests on the diffusion equation with additional terms in the right side, which takes into account the influence of topography, lithologic structure of the territory and the intensity of pollution on the absorption rate of the surface of earth.
In [4] was studied the dispersion and diffusion of active primary pollutants emitted from eleated line sources into stable atmospheric boundary layer with generalized wind speed and quadratic function of the vertical height. For this statement there was obtained an exact solution using Laplace transform for linear sources in the atmospheric boundary layer. It took into account the chemical reaction that occurs as a result of interaction with the air mass, as well as the conversion of gaseous pollutants into the solid particles and their deposition on the surface of underlying area.
In order to monitoring of the atmospheric boundary layer in [5-7] authors developed a mathematical model, numerical algorithms and software for solving the problem of multi-component air movement taking into account the transfer and diffusion of pollutants in the atmosphere, changes of atmosphere’s thermal regime, the phase transition, and the vegetation cover influence.
The analysis of source literature showed that authors did not considered the process of multicomponent harmful substances transport and diffusion in the atmosphere as three-dimensional statement, where a significant role is played by the real speed of the air mass in three directions, the terrain of considered industrial region, the heat exchange between the liquid and gaseous phases, the state of their density and temperature, which is varying in days and seasons, etc.
It should also be noted that many authors assumed that the transfer and diffusion of harmful substances emitted from industrial facilities, does not reach the boundaries of considered area and there is no inflow of harmful substances through the boundaries. In this paper, certain efforts have been made to fill this gap.
3. Problem Statement
The mathematical model of the spread of harmful substances in the atmospheric boundary layer taking into account terrain orography has following form [8-13]:
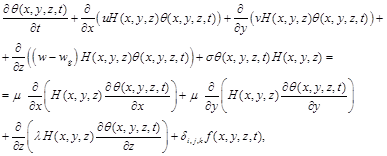 (1)
(1)
![]() (2)
(2)
![]() (3)
(3)
![]() (4)
(4)
![]() (5)
(5)
![]() (6)
(6)
![]() 7)
7)
![]() (8)
(8)
Here ![]() concentration of harmful substances in the atmosphere;
concentration of harmful substances in the atmosphere; ![]() initial concentration of harmful substances in the atmosphere;
initial concentration of harmful substances in the atmosphere; ![]() coordinate system;
coordinate system; ![]() wind speed in three directions;
wind speed in three directions; ![]() rate of particles settling;
rate of particles settling; ![]() – coefficient of harmful substances absorption in the atmosphere;
– coefficient of harmful substances absorption in the atmosphere; ![]() coefficients of diffusion and turbulence;
coefficients of diffusion and turbulence; ![]() Dirac function;
Dirac function; ![]() harmful substances emitter situated on the underlying surface. The parameters
harmful substances emitter situated on the underlying surface. The parameters ![]() in Eq. 1 - Eq. 6 are defined depending on problem statement and can be equal to 0 or 1.
in Eq. 1 - Eq. 6 are defined depending on problem statement and can be equal to 0 or 1.
In this statement the terrain orography and physical and mechanical characteristics of underlying earth surface are accounted by parameters ![]() and
and ![]() . Here
. Here ![]() can be equal to 0 if the layer is under the ground, to 1 if the layer is in the atmosphere, and to
can be equal to 0 if the layer is under the ground, to 1 if the layer is in the atmosphere, and to ![]() – if the layer is under orographic surface.
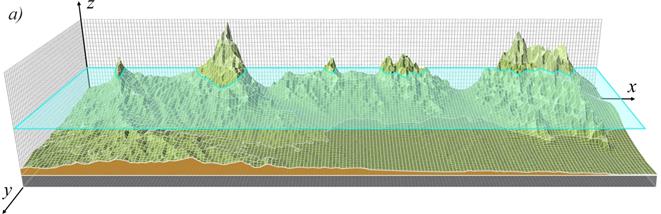
– if the layer is under orographic surface. ![]() is the height of a hill on the plane which is parallel to the sea level and
is the height of a hill on the plane which is parallel to the sea level and ![]() . For each layer of the model we introduced a multiplier
. For each layer of the model we introduced a multiplier ![]() determining the degree of air flow blockage Fig. 1a.
determining the degree of air flow blockage Fig. 1a.
The main parameters of the model are to determine as power functions
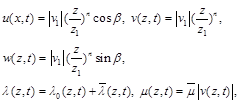 (9)
(9)
where ![]() is a modulus of wind speed when
is a modulus of wind speed when ![]()
![]() –
– ![]() ,
, ![]() –
– ![]() ,
, ![]() –
– ![]() ,
, ![]() – orographic surface.
– orographic surface.
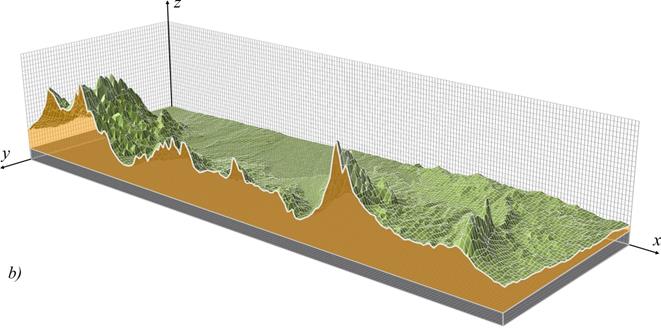
Fig. 1. The relief of terrain along aerosol emissions transport area.
4. Methods
As we can see from the problem statement Eq. 1 - Eq. 8, it is too difficult to obtain an analytical solution. Therefore, for the numerical integration of the problem there was developed a numerical algorithm based on the substitution of differential operators on finite-difference [14].
Also we can see that the main factors and parameters which significantly affect the progress of the spread of harmful substances into the environment by temporary and spatial variables are the coefficients of diffusion, absorption and interaction with the earth's surface, as well as emitters' intensity and their location. It should be noted that the above factors are dependent on climatic factors, the time of day and seasons of year.
In this regards, on the basis of statistical processing of long-term data, there was obtained a sinusoidal dependence for determining the coefficient of absorption of harmful substances in the atmosphere which has following form:
![]() (10)
(10)
Here ![]() daily average change of the coefficient of aerosol emissions absorption in the atmosphere;
daily average change of the coefficient of aerosol emissions absorption in the atmosphere; ![]() amplitude of the absorption coefficient change for a day;
amplitude of the absorption coefficient change for a day; ![]() cyclic frequency of daily change.
cyclic frequency of daily change.
Dunes, hills and ridges that extend above the surrounding terrain play an important role in the changing of wind direction and speed. If the air mass meets a steep hill with a rough surface, the wind speed increases dramatically, which leads to an increase in the coefficient of turbulence Fig. 2b. Thereby, the natural barriers significantly affect the process of transfer and diffusion of pollutants into the atmosphere.
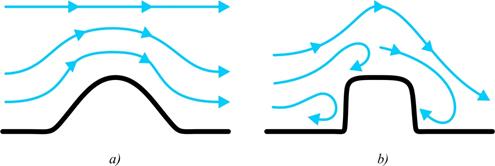
Fig. 2. Air mass flow.
As the high pressure area actually extends some distance to the hill, the wind changes its direction before reaching the hill. Wind speed increases with the difference of atmospheric pressure, but the air flow rate decreases due to friction on underlying surface roughness. Therefore, the wind speed is higher over the hills than over surrounding plain area.
There were numerous attempts to identify the relationship between the content of pollutants in urban air and wind speed. Many authors pointed out that most of the air pollution thrown out by low emitters was observed at slow winds (0 to 1 m/s). When emissions were occured by high emitters, the maximal concentrations of pollution were fixed at dangerous wind speeds (3 to 6 m/s depending on the emission flow rate from exhaust pipes).
Dangerous winds coupled with unstable stratification and intense transfer of impurities lead to the maximum increase in the concentrations of harmful substances in the atmospheric boundary layer. It was brought out that in such cases the horizontal air streams play a principal role in the dissipation of pollutants.
In the course of numerical experiments with real data, the source of values for model parameters is needed. These values should be relevant for considered territory and current time. For this purpose, we developed program interfaces to communicate with geoinformation and weather web-services.
Here we propose an approach to software implementation of developed model and algorithm based on the use of online services such as Google Maps and OpenWeatherMap.
It should be noted that the mentioned online services still impose certain restrictions on data access. For example, ![]() calculation requires an extensive array of elevation data for every point of the solution area. Meanwhile, Google API allows elevation dataset query only as a certain path between two end points. Even this case, the service uses interpolation and returns the averaged values between each four neighbor points.
calculation requires an extensive array of elevation data for every point of the solution area. Meanwhile, Google API allows elevation dataset query only as a certain path between two end points. Even this case, the service uses interpolation and returns the averaged values between each four neighbor points.
To operate the exact elevation values while calculating, it was decided to use SRTM data, the fourth generation of which is available on CGIAR-CSI geoportal. Each pixel of SRTM raster image contains latitude and longitude coordinates, as well as the altitude above sea level in meters. Raster resolution is 90 m (3 angular seconds), and each mosaic tile has a size of 5x5 degrees.
The essence of this approach is as follows. A rectangular grid (area) of geographic coordinates on the interactive map, in the nodes of which we calculate ![]() values, is matched to the same fragment of SRTM raster. Thus, during calculation for each node of the grid the height parameter
values, is matched to the same fragment of SRTM raster. Thus, during calculation for each node of the grid the height parameter ![]() can take accurate values. In addition, the local use of SRTM files greatly reduces the computation time in comparison with the situation when elevation data is retrieved from a remote source through a network.
can take accurate values. In addition, the local use of SRTM files greatly reduces the computation time in comparison with the situation when elevation data is retrieved from a remote source through a network.
Once the emitter marker was placed on the interactive map and its parameters were inputted, it is necessary to determine the current weather conditions for considered area. OWM JAPI library for OpenWeatherMap allow us to obtain weather data automatically by the coordinates of emitter marker placed on the map.
This library is well documented and very easy to use. In fact, the import of current weather data requires only 3-5 lines of code. First, we create an object of class i>OpenWeatherMap and then an object of i>CurrentWeather class whose members can be initialized by i>currentWeatherByCoordinates method. This method takes as arguments the latitude and longitude coordinates. For example, the extraction of wind direction and speed is shown by the following code fragment.
OpenWeatherMap owm = new OpenWeatherMap("");
CurrentWeather cw = owm.currentWeatherByCoordinates(40,92, 69,71);
Double windDirection = cw.getWindInstance().getWindDegree();
Double windSpeed = cw.getWindInstance().getWindSpeed();
All other necessary weather data such as pressure, temperature, humidity, etc. is extracted in an analogous manner to the above.
5. Results
Using developed mathematical and software tools, we conducted a series of numerical experiments. The experiments were conducted for weather and climate conditions of <<Akhangaran-Almalyk-Angrenregion>>, region taking into account the terrain, the values of the air mass velocity horizontally and vertically, the coefficients of absorption of harmful substances and their interaction with the underlying surface. Colors palette in the figures corresponds to the levels of carbon monoxide concentration in the atmosphere. At each time step the calculation accuracy is controlled by the material balance equation Fig. 3 - Fig. 4.
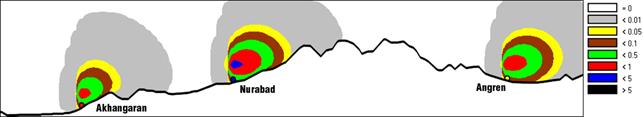
Fig. 3. Distribution of carbon monoxide concentration in the atmosphere after 1 hour.
Horizontal wind speed ![]() m/s. Particles settling velocity
m/s. Particles settling velocity ![]() m/s.
m/s.
Coefficient of diffusion ![]() . Coefficient of turbulence
. Coefficient of turbulence ![]() .
.
Coefficients of absorption ![]() . Time
. Time ![]() h.
h. ![]() .
.
Solution region length ![]() km.
km. ![]() m.
m.
Solution region height ![]() km.
km. ![]() m.
m.
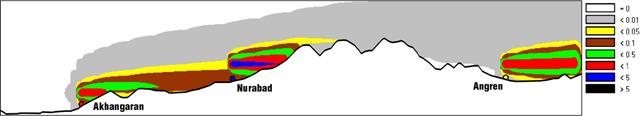
Fig. 4. Distribution of carbon monoxide concentration in the atmosphere after 1 hour.
Horizontal wind speed ![]() m/s.
m/s.
Other parameters as in Fig. 3.
As we can see from Fig. 3 - Fig. 4. the distribution of air pollutants significantly depends on: the terrain where there are emissions from industrial facilities; vertical and horizontal velocity of the air mass; the coefficient of absorption of harmful substances in the atmosphere depending on the humidity, which in turn depends on the time of day and season.
The obtained results showed that with the increase of horizontal wind speed the pollutants dispersion area in the atmospheric boundary layer increases too (Fig. 4). The rate of deposition of particles on the underlying surface mainly depends on the size of aerosol particles and the vertical velocity of the ascending air. The quantity of settled particles depends on the difference in the particles settling velocity and vertical wind speed ![]() .
.
As it was shown by numerical calculations, the maximum absorption of aerosol particles takes place in the morning and evening hours. It was determined that if there is continuous emission of harmful substances from industrial facilities into the atmosphere, a significant change in their concentration will take place precisely due to the absorption coefficient. If there are moderate winds in the «Akhangaran-Almalyk-Angrenindustrial» industrial region then there will be the accumulation of harmful substances which draws the exceeding of pollution standard.
It was determined that dispersing of harmful substances in the atmosphere was significantly influenced by both horizontal and vertical velocity of air mass. Large values of the vertical velocity of the air mass cause chaotic turbulent particles dissipation. With the increase of horizontal wind speed (![]() m/s) particles are carried away beyond the boundaries of solution region (Fig. 5).
m/s) particles are carried away beyond the boundaries of solution region (Fig. 5).
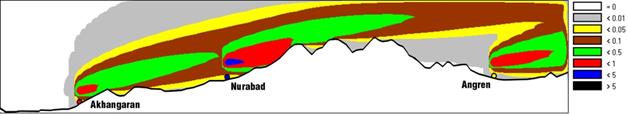
Fig. 5. Distribution of carbon monoxide concentration in the atmosphere after 1 hour.
Horizontal wind speed ![]() m/s. Vertical wind speed
m/s. Vertical wind speed ![]() m/s.
m/s.
Other parameters as in Fig. 3.
The obtained results favorably differ because of the fact that here the weather and climatic factors and mountain-valley air circulation features above Central Asia are taken into account.
Google Maps API provides opportunities for visualization of calculated results. One of them is a heatmap visualization library that describes the data intensity on geographical locations.
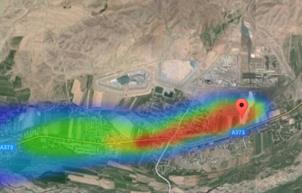
Fig. 6. Visualization of the calculated results of the pollutants .
concentration in the atmospheric boundary layer
The result of the developed algorithm is an array of pollutant concentration values ![]() at each point of emission spread area. Heatmap visualization library allows us to converted obtained array into a color gradient, which is displayed on the map as a semitransparent layer (Fig. 6).
at each point of emission spread area. Heatmap visualization library allows us to converted obtained array into a color gradient, which is displayed on the map as a semitransparent layer (Fig. 6).
6. Summary
Thus, we are able to draw following conclusions:
The most important parameters that affect the erosion of harmful substances from the underlying surface and their transfer into the boundary layer of the atmosphere are the speed of air mass in the atmospheric boundary layer, soil moisture and the coefficient of absorption of harmful substances, which is variable in days and seasons.
Developed mathematical and software tools can be used for optimal placement of newly built industrial facilities, estimating scale and geographical distribution of emissions into the environment, determining concentration of harmful substances in the atmosphere and on the underlying surface with the view of making certain decisions to minimize threats.
Using considered online services we developed a preliminary version of web application for the study, monitoring and forecasting of harmful emissions spread in the atmospheric boundary layer. The used APIs have continuous improvement, active support and comprehensive documentation that much ease to develop own software. Thus, the described approach to software development is fully justified.
Ecologists can apply considered tools to monitor and predict the process of transfer and diffusion of industrial emissions, taking into account local climatic factors, orography and long-term weather data. Also they are able to determine the potential of absorption and concentration of harmful substances in certain region with regards to pollutants' impact on the flora, fauna and people.
References


