Formulation of Surfactants from Coconut Coir Containing Lignosulfonate for Surfactant - Polymer Flooding
Sagala Farad1, 3, 4, Muhammad A. Manan1, Norhisyambin Ismail1, Hussein Kisiki Nsamba2, 3, Emmanuel Galiwango5, Isa Kabenge4
1Department of Petroleum Engineering & Renewable Energy, Universiti Teknologi Malaysia (UTM), Johor, Malaysia
2Section of Industrial Chemistry, department of Chemistry, College of Natural Sciences, Makerere University, Kampala, Uganda
3Invention Plus limited, Kampala Uganda
4Department of Agricultural and Biosystems Engineering, College of Agricultural and Environmental Sciences, Makerere University, Kampala, Uganda
5Department of Chemical Engineering, Kangwon National University, Joonagang-rosamcheok, Gangwon, South Korea
Email address

(S. Farad)
Citation
Sagala Farad, Muhammad A. Manan, Norhisyambin Ismail, Hussein Kisiki Nsamba, Emmanuel Galiwango, Isa Kabenge. Formulation of Surfactants from Coconut Coir Containing Lignosulfonate for Surfactant - Polymer Flooding. American Journal of Science and Technology. Vol. 3, No. 3, 2016, pp. 63-72.
Abstract
Interfacial tension (IFT) reduction between oil and water using surfactants has been used to recover trapped oil after the primary and secondary recovery, however petroleum based surfactants are costly. More research in required on other possible sources of surfactants that can be used to supplement the existing petroleum based surfactants. In this study, surfactant formulations mixed with Lignosulfonate which was sulfonated from local coconut coir lignin, were characterized and screened through micro emulsion phase behavior experiments as a function of Lignosulfonate, primary surfactant, and alcohol concentration. Three different formulations were evaluated for their performance in residual oil recovery when followed with a polymer flood for oil displacement experiments using sand pack model at room temperature. It was found that for the system which used decane as an oil phase, surfactant formulation consisting of 2.0% (w/v) sodium dodecyl benzenesulfonate (SDBS) and 2.0% (v/v) isopentanol was able to give high oil recovery and water solubilization ratios at 2.8% (w/v) NaCl. These oil and water solubilization ratios increased slightly when 2.0 (w/v) lignosulfonate was added into the same formulation.It was evidenced that surfactants generated from coconut coir had higher potential to recover residual oil and more promising when combined with polymers.
Keywords
Black Liquor, Phase Behavior, Lignin, Surfactant, Solubilization, Micro Emulsion
1. Introduction
Tertiary recovery method known as Enhanced oil recovery (EOR) target the remaining oil trapped in reservoirs after primary and secondary recovery (Sen, 2008). EOR offer prospects for producing 30% to 60% (Han, Yang, Zhang, Lou, & Chang, 1999), or more of the original oil in place. The use of surfactant in EOR proved a successful technique to reduce interfacial tension (IFT). However, the cost of the surfactants has been the main reason for their limited use in the EOR processes (Routledge & Sumpter, 1996). Therefore
in developing new surfactant beside high cost of manufacturing, the availability of the initial material must be considered, if the starting material is readily available, easy to obtain and exists in abundance, there is possibility that the cost of producing the surfactant will be less. Lignin based surfactant have been proposed to be used in EOR because of their source and cost of their formulation which is low. According to (DeBons & Whittington, 1992). Also in comparison, lignin amines are not based to the price of crude oil unlike petroleum based surfactant, and have been relatively constant in price therefore this study is investigating the application of surfactant formulation that was produced from coconut coir.
The surfactant formulations for EOR studied by previous researchers through phase behavior experimentation mainly consisted of primary surfactant, co-surfactant, co- solvent and alkali with targeted crude oil or refined oil (Flaaten, 2007). However, regarding on evaluation of the performance of lignosulfonate as new components in surfactant formulations, most of the studies were focused on using commercially available lignosulfonate only and measured its ability to reduce IFT through tensiometer instruments (Rana, Neale, & Hornof, 2002). Therefore, in this study, lignosulfonate prepared from coconut coir, was added in surfactant formulation together with primary surfactant and co-solvent, characterized through micro emulsion phase behavior experimentation and applied as surfactant slug in the oil displacement experiment. The lignosulfonate prepared from coconut coir was added in surfactant formulation together with primary surfactant and co-solvent, characterized through micro emulsion phase behavior experiment and applied as surfactant-polymer slug in the oil displacement experiment.
2. Methodology
The coconut coir raw material used in extraction of lignin was obtained from local plantation source. In this study soda pulping process was used to extract lignin from the Coconut coir using the lignin extraction procedure (M. M. Ibrahim, Ibrahim, Azian, & Azian, 2005). The extracted lignin was converted into lignosulfonate by sulfonation process.
2.1. Sulfonation of Extracted Lignin
Following the procedure of (Pepper, Baylis, & Adler, 1959) the lignin powder that was obtained was mixed with sodium sulfite, Na2SO3 and de-ionized water in the glass bottle in the ratio1:0.5:10. Initial pH of mixture kept at 6.8 and was adjusted to pH 9.0 using 20% (w/v) NaOH solution to dissolve the lignin. This mixture was then capped and heated to 80°C for 4 hours with stirring. After sulfonation, the mixture was then evaporated in the convection oven until a dried solid was obtained and crushed to fine powder using mortar and pestle. This fine powder lignosulfonate then stored in bottle for subsequent process and analysis.
2.2. Characterization of Lignosulfonate Using FTIR Spectroscopy
The characterization using Fourier Transform Infra-red (FTIR) method was applied on these products. The infrared spectra of commercial and extracted lignin and lignosulfonate were run in KBr discs using a Perkin Elmer Spectrum One Fourier Transform Infra-Red (FTIR) spectrophotometer in the frequency range of 4000 – 400cm-1. The dry powder of these chemicals were mixed with potassium bromide (KBr) and Pressed into pellets under pressure to form a thin KBr disc. The adsorption frequency spectra was recorded and plotted and this FTIR spectrophotometer gives the adsorption spectrum in percentage incident intensity. The IR spectrums then used to identify the functional group present in the commercial and extracted lignin and lignosulfonate.
2.3. Phase Behavior Experiments
Phase behavior experiments involved mixing certain proportions of aqueous chemical solutions, brine and oil in an array of test tube. This stage of experiment was applied as a tool to evaluate the chemical components used and select favorable surfactant formulations for the surfactant slug in oil displacement experiment. Each set of test tube array were prepared with incremental electrolyte concentration from 0% (w/v) to 5% (w/v) for different surfactant formulation. The phase behavior experimentation of surfactant formulations was started by screening formulations with different alcohol type and concentration. Only one type and concentration of alcohol was selected for the next subsequent surfactant formulations. Then, the formulations with two different concentrations of primary surfactant and different concentration of commercial lignosulfonate were analyzed and screened for the best performance to be selected as surfactant slug in oil displacement experiment.
2.4. Chemical Formulations
The main surfactant used in this study was sodium dodecyl benzene sulfonate (SDBS) made by Sigma-Aldrich with technical grade (85% purity). Sulfonate surfactants have been experimented and applied in EOR applications due to their stability at much higher temperature, compared to the sulfates surfactant (Singh, Van Hamme, & Ward, 2007). Commercial sodium lignosulfonate (LSC) was manufactured by Sigma-Aldrich in brown powder form. This chemical used as comparison with the extracted lignosulfonate (LSE).
2.5. Samples Preparation
Two different phases of liquids were added in each test tube of micro emulsion phase behavior experiment oil and aqueous phase. Decane was used as oil phase but in several experiments, heptane, octane, tetradecane and hexadecane were also used. As for aqueous phase, the stock solution of surfactant formulation was mixed with brine stock solution and de-ionized water. Surfactant formulation stock solutions were prepared by mixing SDBS, alcohol and lignosulfonate with de-ionized water to the desired concentration in the bottles. The purity of these chemicals was considered to determine the amount needed to prepare their stock solutions. Once the stock solutions was prepared in the glass bottles, an orbital shaker was used to mix these chemicals in the solution until they were completely dissolved. Brines stock solution with concentration of 10% (w/w) was prepared by dissolving NaCl in de-ionized water. It was used to introduce electrolytes and create a salinity gradient in each test tube. Once the stock solution was prepared in the bottles, magnetic stir bar was inserted and stirred on a stir plate until the chemical was completely dissolved into solution.
2.6. Screening of Formulations
All surfactant formulations that were used in phase behavior experiment had to be screened and pass several criteria to be considered for oil displacement experiment. The surfactant formulations having the highest oil and water solubilization ratios values at optimal salinity were selected. High values of these parameters correlated with low IFT, an important factors of residual oil mobilization for the next stage of experiment.
3. Oil Displacement Experiment
Figure 1 shows the schematic diagram of oil displacement equipment setup for the brine flooding, oil flooding, water flooding and surfactant-polymer flooding. The sand pack model was in vertical position so that gravity would assist to stabilize the oil-aqueous solution interface during the process. The prepared sand pack was fully saturated with brine and latter a series of flooding experiments were conducted to measure several parameters and finally surfactant flooding was applied to recover the residual oil. Wet packing technique was used in the preparation of sand packs.
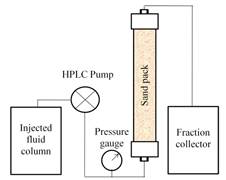
Figure 1. Oil displacement equipment schematic diagram.
3.1. Preparation of Sand Pack Model
Wet packing technique was used during preparation of sand pack. Silica sand and brine (2.0% (w/v) NaCl) were added alternately. These attempts were taken to produce a sand pack with the porosity and permeability values as low as possible. The pore volume of sand pack was determined through the volume of brine injected.
3.2. Surfactant Polymer Flooding
Surfactant flooding was conducted after the water flooding by injecting a surfactant slug (0.3 PV) into the sand pack with an injection rate of 0.5 ml/min. Then, this slug was followed by 1.0 PV of polymer drive. Effluent collected from the outlet using fraction collector.
4. Results and Discussion
4.1. Soda Pulping Process of Coconut Coir and Sulfonation of Lignin into Lignosulfonate
Soda pulping was performed for delignification process of lignin into smaller, water-soluble fragments and separate the aqueous black liquor from the fibrous carbohydrate materials, the coconut coir was cooked with 25% (w/w) of NaOH at temperature higher than water boiling points (170°C) in the rotary digester for 3 hours. NaOH dissociated in water to give hydroxide ion (OHˉ) and used to promote reaction for the breakdown and dissolution of the lignin fragments, high NaOH concentration was required in this process because the cleavage and fragmentation reactions which occurred in the soda pulping were strongly influenced by the concentration of NaOH.
4.2. Lignin Recovery from Black Liquor
Lignin was recovered from the black liquor through the acid precipitation process by converting soluble lignin into a solid form at pH below the pKa of phenolic group. In this study, sulfuric acid was used and the usage of sulfuric acid produced aconsiderate amount of solid lignin at the end of process. Since the lignin recovered was to be sulfonated into lignosulfonate, this selection of acid could reduce contamination of other types of ion in the solid lignin during sulfonation process.
4.3. Sulfonation of Lignin
Sulfonation of lignin was conducted to obtain the soluble lignosulfonate. In the reaction mechanism, lignin initially was converted into a quinone methide. This intermediate product was due to loss of hydroxyl group at benzyl (α) carbon position of aromatic ring in the lignin structure. Then, sulfonate group acted as a nucleophile and introduced to the α carbon position to form lignosulfonate.
4.4. Characterization of Lignosulfonate Using FTIR Spectroscopy
Commercial and prepared lignosulfonate were characterized and compared using Fourier Transform Infra-red (FTIR) spectroscopy. Using this technique, the vibrations of several important bonds were observed and used to provide evidence of the functional group present in the commercial and extracted lignosulfonate samples. Figure 2 shows the FTIR spectra of commercial (spectrum A) and prepared (spectrum B) lignosulfonate. A broad band at 3434 cm-1 (spectrum A) and 3436 cm-1 (spectrum B) were referred to the stretching of O–H group in phenolic and aliphatic side chain structure. High intensity of this band could also be affected by the moisture in the samples tested. Two bands in spectrum A (2942 cm-1 and 2845 cm-1) and spectrum B (2935 cm-1 and 2840 cm-1) were resulted from the C–H stretching vibrations in aromatic methoxyl group (–OCH3), methyl (–CH3) and methylene (–CH2–) of side chains structure. Conjugated carbonyl (C=O) stretching vibrations occurred from the bands at 1636 cm-1 (spectrum A) and 1625 cm-1 (spectrum B). The stretching vibrations of C–O bond which were mainly from the C–O–C ether structure, the bands appeared at 1042cm-1 in spectrum A and 1042 cm-1 in spectrum B. The existence of aromatic structure for both the commercial and extracted lignosulfonate was proved by the two bands in spectrum A (1607 cm-1 and 1509 cm-1) and spectrum B (1603 cm-1 and 1518 cm-1). They were originated from the C=C bonds of aromatic ring vibration. The bands at 1459 cm-1 (spectrum A) and 1458 cm-1 (spectrum B) could also be used to refer to this aromatic ring vibration but usually at this wavelength, they were directly overlapped with the C–H bond deformation vibrations of methyl and methylene (Mayo, 2004). The symmetric stretch vibrations of S=O bond was appeared as a strong bands at 1208 cm-1 (spectrum A) and at 1191 cm-1 (spectrum B). Also, the bands exist at 654 cm-1 (spectrum A) and 624 cm-1 (spectrum B) which referred to the C–S bond stretching (Bell & Dean, 1970); (M. N. M. Ibrahim, Zakaria, Sipaut, Sulaiman, & Hashim, 2011). These bonds were used to confirm the existence of sulfonate group in the compounds. The sulfonation process done earlier was able to attach sulfonate group on the lignin structure and convert it into lignosulfonate
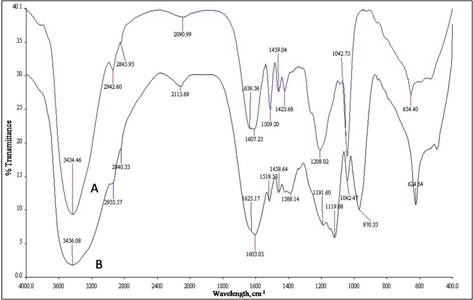
Figure 2. FTIR Spectra of commercial (A) and prepared (B) lignosulfonate.
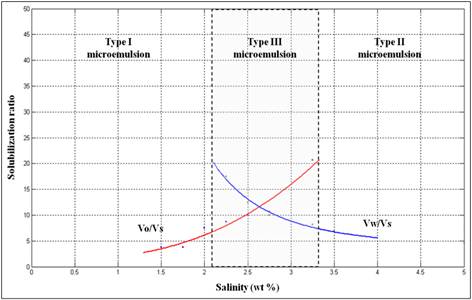
Figure 3. Example of phase behavior experiment data plots using surfactant formulation containing 2.0% (w/v) SDBS, 2.0% (v/v) isopentanol and 0.75% (w/v) lignosulfonate with decane as oil phase.
4.5. Characterization of Surfactant Formulations via Micro Emulsion Phase Behavior Experiments
Phase behavior experimental studies were made to characterize and screen the different types and concentrations of alcohol, Concentration of surfactant (SDBS) and Concentration of lignosulfonate. The experiment was applied to determine the existence of Type III middle phase micro emulsion where the maximum oil and water solubilization occurred. This screening procedure was conducted through salinity scan by positive salinity gradient and other variables were kept constant. By increasing the electrolytes concentration, transition of Type I to Type III to Type II micro emulsions. The oil solubilization ratio (Voil/Vsurf) was increased but the water solubilization ratio (Vwater/Vsurf) was decreased. When both solubilization ratios were plotted (Figure 3), the solubilization value showed an intersection point occurred within Type III micro emulsion salinity region known as optimum solubilization ratio and the salinity at this point known as optimum salinity. The optimum solubilization ratio is related to the lowest IFT that can be reduced in the system, which is important for the mobilization of oil in EOR (Austad & Milter, 2000), (Iglauer, Wu, Shuler, Tang, & Goddard, 2009), (Trabelsi et al., 2011)
4.6. Effect of Alcohol Types and Concentrations
Several types of alcohols were tested with different chain such as isopropanol, sec-butanol, n- butanol and isopentanol. Result of phase behavior experiments using isopropanol, sec-butanol and n- butanol as a co-solvent show that these alcohols were not suitable to be combined with SDBS in formulation. When using these alcohols, some of formulations form white rigid phases in between the aqueous phases. Only phase behavior experiments using isopentanol as a co-solvent were considered in this study due to the good performances. This alcohol was varied from 1.0 to 3.0% (v/v) while other components composition kept constant.
4.7. Oil Displacement Experiment
Three selected formulations A, B and C were used as surfactant slug in this experiment (Table 1). The objective of SP flooding was to recover the residual oil in place after water flooding and hydrolyzed polyacrylamide (HPAM) was used for polymer injection to follow the surfactant slug.
Table 1. Composition of selected surfactant formulations.
| Formulation | SDBS, % (w/v) | Isopentanol, % (v/v) | Type | Lignosulfonate Concentration % (w/v) % | Nacl(w/v) |
| A | 2 | 2 | - | 1.75 | 2 |
| B | 2 | 2 | commercial | 1.75 | 2 |
| C | 2 | 2 | prepared | 1.75 | 2 |
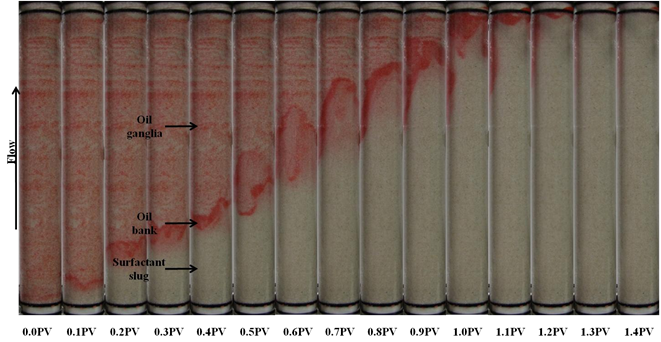
Figure 4. Surfactant flooding of Formulation A in silica sand pack at different injecting pore volume.
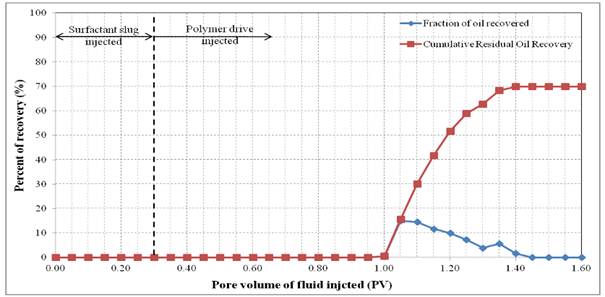
Figure 5. Oil recovery for surfactant flooding of Formulation A in silica sand pack.
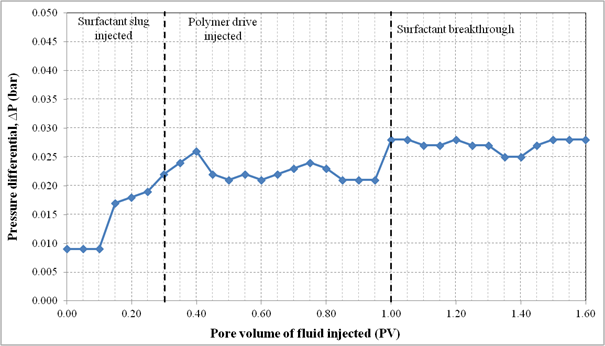
Figure 6. Pressure profile during surfactant flooding of Formulation A in silica sand pack.
4.8. Oil Displacement Experiments with Formulation A
Formulation A consisted of 2.0% (w/v) SDBS, 2.0% (w/v) IPE and 2.0% (w/v) NaCl. This formulation was injected as 0.3 PV surfactant slug in the SP flooding. The Waterflood remaining oil saturation, Sorw for the sand pack was 0.15. The 0.3 PV of surfactant slug injection was followed by 1.5 PV of polymer drive at flowrate of 0.5 ml/min. Figure 4 shows the sand pack during this SP flooding, an oil bank was formed after 0.1 PV of fluids injected. The oil bank was propagating in front of the surfactant slug and its size increased throughout the process. From Figure 5, about 70.0% of the residual oil (ROIP) was recovered after 1.40 PV fluids injected and above this PV, no significant volume of oil was produced. However, surfactant breakthrough occurred at 0.90 PV because of the lower phase micro emulsion observed in effluent collected at that time. The aqueous solution of effluent became cloudy due to an amount of oil solubilized in this phase. After water flooding stage, about 80.3% of OOIP was recovered leaving water flooding residual oil saturation, Sorw of 15.0%. Then, after applying this formulation as surfactant slug in SP flooding, additional 13.8% of OOIP was recovered, making the total OOIP recovered for this oil displacement experiment as 94.1% with final residual oil saturation (Sorc) of 4.0%. The history of pressure drop provided in Figure 6 shows that the pressure increased significantly after 0.10 PV of the injection of chemicals, due to the viscosity of surfactant slug and polymer drive that was higher than that of brine and oil filled in the sand pack. The pressure then became stable and changed slightly after surfactant breakthrough at 1.00 PV because the whole sand pack was occupied by the surfactant slug and polymer drive.
4.9. Oil Displacement Experiments with Formulation B
Formulation B composed of 2.0% (w/v) SDBS, 2.0% (w/v) IPE, 0.75% (w/v) commercial lignosulfonate and 2.0% (w/v) NaCl. For this oil displacement experiment, the Waterflood remaining oil saturation, Sorw for the sand pack was 0.1935, 0.3 PV of surfactant slug containing Formulation B was injected, followed by 1.5 PV of polymer drive. These fluids were injected at flowrate of 0.5 ml/min. Figure 7 shows the sand pack model during this SP flooding. An oil bank started to be formed after 0.1 PV of fluids injected. The oil bank was propagating in front of the surfactant slug and its size was increasing throughout the process. From Figure 8, about 60.4% of the residual oil (ROIP) was recovered after 1.35PV fluids were injected and above this PV, no significant volume of oil was produced. Surfactant breakthrough happened after similar PV was injected because the lower phase micro emulsion was observed in the effluent collected in the same test tube. The aqueous solution of effluent became cloudy due to an amount of oil solubilized in this phase. In this experiment, about 72.6% of OOIP was recovered after water flooding stage leaving water flooding residual oil saturation, Sorw of 19.0%. Then, after applying this Formulation B as surfactant slug in SP flooding, additional 16.6% of OOIP was recovered, making the total OOIP recovered for this oil displacement experiment as 89.1% with final residual oil saturation of 8.0%. The history of pressure drop provided in Figure 9 shows that the pressure increased significantly with the injection of surfactant slug, due to its viscosity that was higher than brine and oil filled in the sand pack. The pressure then started to slightly decrease after injection of polymer slug but significantly increased after surfactant breakthrough happened. After 0.95 PV, the pressure became stable for several PV fluids injected because the whole sand pack was occupied by the surfactant slug and polymer drive.
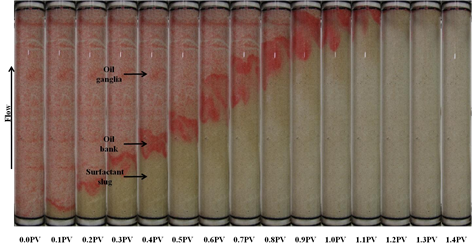
Figure 7. Surfactant flooding of Formulation B in silica sand pack at different injecting pore volume.
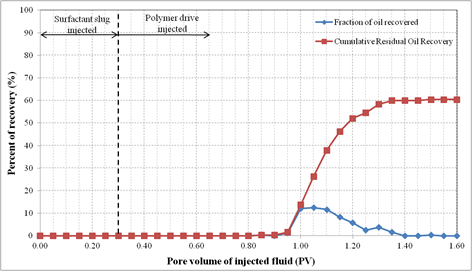
Figure 8. Oil recovery for surfactant flooding of Formulation B in silica sand pack.
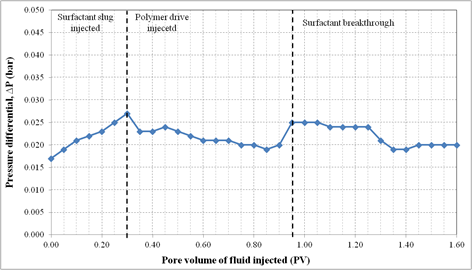
Figure 9. Pressure profile during surfactant flooding of Formulation B in silica sand pack.
4.10. Oil Displacement Experiments with Formulation C
Formulation C consisted of 2.0% (w/v) SDBS, 2.0% (w/v) IPE, 0.75% (w/v) extracted lignosulfonate and 2.0% (w/v) NaCl. For this oil displacement experiment, the Waterflood remaining oil saturation, Sorw for the sand pack was 0.1774. Then 0.3 PV of surfactant slug containing Formulation C was injected, followed by 1.5 PV of polymer drive. These fluids were injected at flowrate of 0.5 ml/min. Figure 10 shows the sand pack during this SP flooding. An oil bank was formed after 0.1PV of fluids were injected. The oil bank was propagating in front of the surfactant slug and its size increased throughout the process. From Figure 11, about 72.3% of the residual oil (ROIP) was recovered and no significant volume of oil was produced after 1.35 PV fluids injected. Surfactant breakthrough happened after similar PV was injected because the lower phase micro emulsion was observed in the effluent collected in the same test tube. The aqueous solution of effluent became cloudy due to an amount of oil solubilized in this phase. In this experiment, about 74.4% of OOIP was recovered after water flooding stage leaving water flooding residual oil saturation, Sorw of 18.0%. Then, after applying Formulation C as surfactant slug in SP flooding, additional 18.3% of OOIP recovered, making the total OOIP recovered for this oil displacement experiment as 93.1% with final residual oil saturation of 5.0%. The history of pressure drop provided in Figure 12 shows that the pressure increased significantly with the injection of surfactant slug, due to its viscosity that was higher than that of brine. The pressure started to drop after injection of the polymer slug but significantly increased after surfactant breakthrough. After the surfactant breakthrough, the pressure became stable for several PV fluids injected because the whole sand pack was occupied by the surfactant slug and polymer drive.
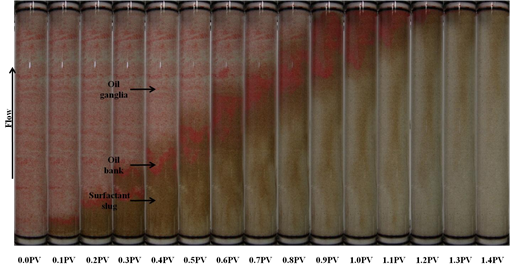
Figure 10. Surfactant flooding of Formulation C in silica sand pack at different injecting pore volume.
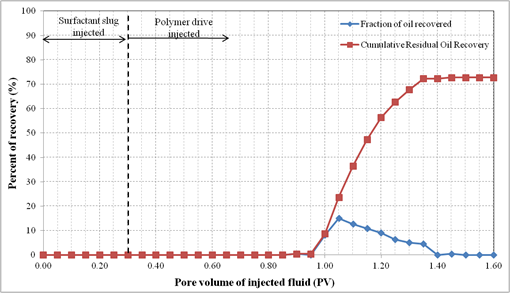
Figure 11. Oil recovery for surfactant flooding of Formulation C in silica sand pack.
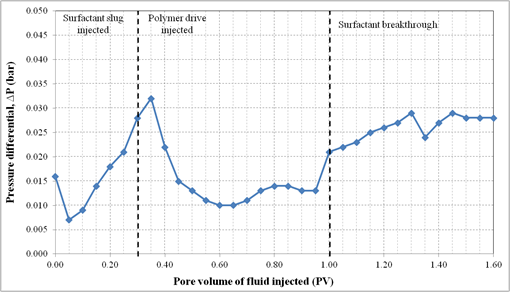
Figure 12. Pressure profile during surfactant flooding of Formulation C in silica sand pack.
5. Conclusion
Micro emulsion phase behavior experiments could be applied to screen surfactant formulation and only isopentanol was suitable to be used in the formulation. Addition of lignosulfonate was able to increase the optimum solubilization ratio up to 11.7 at 0.75%wt of lignosulfonate used and then decreased beyond this value. Surfactant formulation consisting of 2.0% (w/v) SDBS and 2.0% (v/v) isopentanol was able to have an incremental of 13.8% of residual oil in place (ROIP) recovered after water flooding. Addition of 0.75% (w/v) commercial and extracted lignosulfonate in surfactant formulation of 2.0% (w/v) SDBS and 2.00% (v/v) isopentanol were able to have an increment up to 16.6% and 18.3% of ROIP recovered after water flooding, respectively.
Acknowledgment
The authors are grateful to university of Teknologi Malaysia and the Ministry of science, Technology and Innovations for awarding the research grant.
References
- Austad, Tor, & Milter, Jess. (2000). Surfactant flooding in enhanced oil recovery. Surfactants: Fundamentals and Applications in the Petroleum Industry, 203-249.
- Bell, RJ, & Dean, P. (1970). Atomic vibrations in vitreous silica. Discussions of the Faraday society, 50, 55-61.
- DeBons, FE, & Whittington, LE. (1992). Improved oil recovery surfactants based on lignin. Journal of Petroleum Science and Engineering, 7 (1), 131-138.
- Flaaten, Adam Knut. (2007). Experimental study of microemulsion characterization and optimization in enhanced oil recovery: a design approach for reservoirs with high salinity and hardness. University of Texas at Austin.
- Han, Da-Kuang, Yang, Cheng-Zhi, Zhang, Zheng-Qing, Lou, Zhu-Hong, & Chang, You-Im. (1999). Recent development of enhanced oil recovery in China. Journal of Petroleum Science and Engineering, 22 (1), 181-188.
- Ibrahim, MN Mohamad, Ibrahim, MN Mohamad, Azian, H, & Azian, H. (2005). Extracting soda lignin from the black liquor of oil palm empty fruit bunch. Jurnal Teknologi (C), 42 (C), 11-20.
- Ibrahim, Mohamad Nasir Mohamad, Zakaria, Norhidaya, Sipaut, Coswald Stephen, Sulaiman, Othman, & Hashim, Rokiah. (2011). Chemical and thermal properties of lignins from oil palm biomass as a substitute for phenol in a phenol formaldehyde resin production. Carbohydrate polymers, 86 (1), 112-119.
- Iglauer, Stefan, Wu, Yongfu, Shuler, Patrick, Tang, Yongchun, & Goddard, William A. (2009). Alkyl polyglycoside surfactant–alcohol cosolvent formulations for improved oil recovery. Colloids and Surfaces A: Physicochemical and Engineering Aspects, 339 (1), 48-59.
- Mayo, Dana W. (2004). Characteristic Frequencies of Aromatic Compounds (Group Frequencies of Arenes). Course Notes on the Interpretation of Infrared and Raman Spectra, 101-140.
- Pepper, JM, Baylis, PET, & Adler, E. (1959). The isolation and properties of lignins obtained by the acidolysis of spruce and aspen woods in dioxane-water medium. Canadian Journal of Chemistry, 37 (8), 1241-1248.
- Rana, D, Neale, G, & Hornof, V. (2002). Surface tension of mixed surfactant systems: lignosulfonate and sodium dodecyl sulfate. Colloid and Polymer Science, 280 (8), 775-778.
- Routledge, Edwin J, & Sumpter, John P. (1996). Estrogenic activity of surfactants and some of their degradation products assessed using a recombinant yeast screen. Environmental Toxicology and Chemistry, 15 (3), 241-248.
- Sen, Ramkrishna. (2008). Biotechnology in petroleum recovery: the microbial EOR. Progress in Energy and Combustion Science, 34 (6), 714-724.
- Singh, Ajay, Van Hamme, Jonathan D, & Ward, Owen P. (2007). Surfactants in microbiology and biotechnology: Part 2. Application aspects. Biotechnology advances, 25 (1), 99-121.
- Trabelsi, Siwar, Argillier, Jean-Franc ̧ois, Dalmazzone, Christine, Hutin, Anthony, Bazin, Brigitte, & Langevin, Dominique. (2011). Effect of added surfactants in an enhanced alkaline/heavy oil system. Energy & Fuels, 25 (4), 1681-1685.


