| 1. | ||
| 2. | ||
| 3. | ||
| 3.1. | ||
| 3.2. | ||
| 3.3. | ||
| 3.4. | ||
| 4. | ||
Model Study of Urban Plant-Soil Complex in Dragalevtzi Experimental Base, Sofia University "Kl. Ohridski"
М. Lyubenova1, М. Grozeva2, N. Georgieva1, М. Zhiyanski2, A. Asenov1
1Department Ecology and EP, University of Sofia, Faculty of Biology, 8 D. Tzankov Blvd., Sofia
2Forest Ecology Department, Forest Research Institute-BAS, 132 Kl. Ohridski, Sofia, Bulgaria
Email address

 (М. Lyubenova)
 Citation
М. Lyubenova, М. Grozeva, N. Georgieva, М. Zhiyanski, A. Asenov. Model Study of Urban Plant-Soil Complex in Dragalevtzi Experimental Base, Sofia University "Kl. Ohridski". International Journal of Ecological Science and Environmental Engineering. Vol. 3, No. 3, 2016, pp. 52-67.
Abstract
The urban territories cause an enormous ecological footprint, affecting resources and biodiversity far beyond the cities boundaries. The urban revitalization therefore involves creation of habitat classification and methods developing for their assessment and optimization to supply services within the cities. The main aim of research is to demonstrate a model for the urban territory assets and services assessment. The indicators used are: water-physical properties of soil, dynamics of soil water supply, spectrums of biological types, life forms and floral elements, phenology, primary production and its quality – biomass fractions participation, nitrogen and crude protein content. The object relates to the J6 habitats sub-group by EUNIS habitat classification. Two experimental variants - fertilized and non-fertilized maize culture (variety Kneja – 509) are used. The obtained results show decreasing of Vertisols water capacity, its monthly dynamics, weed species richness and biological competition at fertilization, which reflects on the water supply and water potential. The biological spectrum is dominated by the perennial plants, the life spectrum – by the hemicryptophytes and terrophytes and the geoelements spectrum - by Euro-Asian and synantropic species (mainly apophytes). The rapid vegetative phase of maize onset, the differences in the sub-stages participation and a month earlier onset of weeds flowering are observed at fertilization. The duration and extent of mass occurrence of phenophases vary specifically for each weed species. The reported average production increases, respectively 1.8 and 1.3 times for maize and weeds at fertilization. The biomass structure is also changed at fertilization - the maize aboveground and the weeds belowground biomass increase compared to non-fertilized plot and vice versa, perhaps due to the weeds striving to capture the mineral elements better than the culture do. The changes of weeds dominant structure are also been observed. The estimated amount of nitrogen in the total production of maize decreases, while this of crude protein increases at fertilization. The indicators and indexes considered in the conducted model study are very sensitive to the cultivation practices and to the variation in the environmental factors. In the same time they are important characteristics of ecosystem functioning and they are widely used in the scientific investigations. However, their development as a complex application for the assessment of assets, capacity and potential of ecosystem services supplied from urban habitats is the originality of the study. They can also be applied to the urban habitats modeling and monitoring.
Keywords
J6 Habitat Sub-group, Plant Complex, Maize Culture, Dynamics of Soil Water Reserves, Phenology, Primary Production, Nitrogen and Crude Protein, Ecosystem Assets and Services
1. Introduction
Growing enormous pace utilization of natural resources and emerging local environmental crises, warning of a possible global crisis, have encouraged efforts by the international community for assessment and valuation of ecosystem services (ES) and making these natural capital goods that the human should be take care of its turnover, durability and maintenance. All this would ensure sustainable existence of human society and its environment. In 2014 it Intergovernmental Platform on Biodiversity and Ecosystem Services [1] in Europe was established, through which to coordinate all activities related to the conceptual development of the problem, build a strategy and program for implementation of identified activities and coordinating the activities of international community of decision-makers, experts and other stakeholders for program implementation. The aggregation of environmental information and developing a network of indicators for assessing ES of habitat is one of the primary task in the program. In US, the scientific and practical work about ES is coordinated by American Environmental Agency and Department of Economic and Social Affairs, Statistics Division United Nations. So the global scientific community nowadays produces an enormous amount of developments in the area [3, 4, 5 and others].
By 2020, 80% of the human population is expected to live in European cities [6]. Although the small area of urban territories (around 4% of European surface) causes an enormous ecological footprint, affecting resources and biodiversity far beyond boundaries of cities [7]. The urban revitalization therefore involves creation of new Urban ecosystems concepts of bringing nature back into the city and combining it with attractive public spaces. Creating and improving green areas, revitalizing brownfields, greening roofs and walls, at the same time as maintaining urban density and compactness, improves the supply of ecosystem services within cities. The diversity of urban territories by structure and functioning (mainly in the energy fluxes and functional units) requires the development of strong classification and methodology [8, 9, 10 and others]. An important task in all activities is a manifestation of indicators for assessment and monitoring of ecosystem services of urban habitats.
The main aim of the study performed is to demonstrate a model study for the urban territory assessment by a complex of indicators. The indicators and indexes considered in the conducted model study are very sensitive to the cultivation practices and to the variation in the environmental factors. In the same time they are important characteristics of ecosystem functioning and they are widely used in the scientific investigations. The research includes morphological description of soil horizons and characterization of mechanical and chemical composition of soil horizons, as well as the soil-water-physical properties – evaporation, dynamics of water supply during the vegetation period and energetic potential (levels) of soil moisture on two experimental variants with fertilized and non-fertilized maize culture. The water regime in the soil is an important indicator for the biodiversity, intensity of biological turn over and primary production. They are plenty of publications about these indicators, some recent of them are of Han et al. [11], Shafiee et al. [12], Oliveira [13] and many others. The productive capacity of soil is studied by some indicators as: primary production of maize culture (variety Kneja – 509, first generation) and quality of this production – the biomass fractions percentage participation and nitrogen and crude protein content. Some of these indicators are used recently [14,15], but the maize are the object of continued interest in the various aspects, because of its importance for humans as food and for livestock production. The other selected indicators link with the biodiversity of natural and cultural communities and plant complexes - species composition, spectrum of life forms, floral elements and anthropophytes as well as the phenological development of plant species in agroecosystem. The selected object for the investigation is situated in Sofia city, Dragalevtzi experimental base of Sofia University (DEB). The object relates to the J6 habitats sub-group by EUNIS habitat classification [16,17]. The selected habitat is very important territory among the urban habitat units as it can provide all categories of ES – provisioning, supporting, regulating and cultural. It can be the object of modeling as well.
2. Оbject and Methods
The DEB is located in Sofia, region "Hladilnika" and covers an area of 75 dka at 609 m a.s.l. The geographical coordinates are: N- 42° 39’13,67’’ and. E 23° 19’ 30,14’’ (Fig. 1).
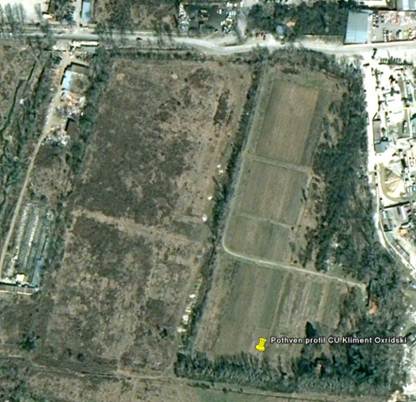
Fig. 1. Sattelite picture of location.
According to the physical-geographical zonation of Bulgaria, the case-study area could be referred to the sub-Balkan high valleys of the Balkan region [18]. According to the climatic zonation, the site is within the continental zone with moderate climate. The climate is characterized by warm summers and cold winters, large temperature variations and long-lasting snow cover. The mean January temperatures are 0° to - 1.5°C, mean July temperatures are 22°-24°C. The average annual precipitation is 520-650 mm, with a maximum in May - June and a minimum in February - March [19]. During the growing season of 2009, there were heavy rains with quantities of 20 to 60 mm registered on the following dates: 18, 29 and 30 of May, 22 – 26 of June, 30 of June – 1st of July, 11 - 12 of July, 4 - 6 of August and 5 – 7 of September. According to the soil zonation of the country, the region of study is located in the Balkan-Mediterranean sub-region [20]. According to the unpublished data, soils are anthropogenic, slightly leached Vertisols (VR). The underlying geology is formed by rock from Pliocene clays and old-quaternary sediments originating from different petrographic composition of weathering products. According to the geo-botanical zonation of the country, DEB is located in the Sofia region, Sofia district of Illyrian province of the European deciduous region [21].
The soil sampling was performed per constant soil profile at the filed. For its security, the roof construction was prepared over the profile. The soil profile was used for morphological description of soil horizons and characterization of textural and chemical composition of soil horizons, as well as its water-physical properties in compliance with the relevant methodologies [22-25]. Per every 10 days during the growing season on a schedule, soil was sampled in 8 test sites in 10 cm distance for whole 0-80 cm of depth with a soil core. Samples were stored in numbered crucibles known package, dried to the absolute dry weight, according to the methodology and weighed again [26,27]. The weight of evaporated water was calculated. Based on these data, the dynamics of the water supply (WS) in soil layers up to 80 cm depth was calculated, as follows:
WS - Md = 10*d*bρ*W,
where: d is the depth of soil layer in m; bρ - bulk density in g.cm-3; W - humidity (% by mass of the solid phase of the soil); Θ = bρ*W - volumetric moisture; Ψ (Θ) = -A*Θ-B (A = 1560* ΘwpB). The values of A and B are given in Table 1.
Table 1. A and B values for the soil of DEB.
| Depth of soil layer, cm | A | B |
| 0 - 20 | 10767532583 | 5.4598 |
| 2- 42 | 2.50042E+12 | 6.9903 |
| 42 - 63 | 2.95603E+12 | 7.4066 |
| 63 – 79 | 1.07049E+14 | 8.6511 |
The determining of water supply dynamics during the growing season is an important soil characteristic for the primary production and an indicator for the energetic levels calculating. The energetic potential of soil moisture is calculated per layers for both versions of the experience during the vegetation period. The vegetation period in 2009 was 123 days (from 22 of May to 25 of September). The energetic levels of soil moisture in background conditions - the specific soil and climatic conditions, as well as in experiment variants are calculated.
The natural and cultural plant species complex are described and the defined spectrum of life forms, floral elements and anthropopytic is presented [28-31]. The diversity of soil invertebrates was investigated by collecting and reporting the density of soil invertebrates through manual collection and sifting through soil samples.
The productive capacity of soil at the led agricultural practices was established by maize culture (variety Kneja – 509, first generation) on two variants. The variety is simple interlinear hybrid, created at the Institute of corn, Kneja [32]. The sowing was held on 14th of May, 2009 at the rate of 3 kg.dka-1 (1dka=1000 m2) The cultivation was done in two variants - 1 dka without fertilization (I) and 1.2 dka with fertilization (II) - Fig. 2.
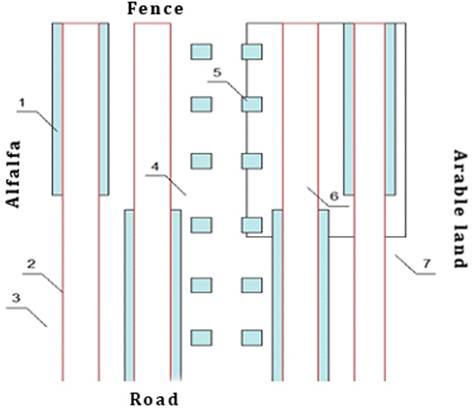
Fig. 2. Scheme of experimental area.
Legend:
1. 8 test sites for maize culture (50/1 m)
2. rows
3. 1st variant of maize culture – with fertilization, 1 dka
4. headland
5. 12 test sites for weeds in maize culture (1/1 m)
6. spacing
7. 2nd variant of maize culture – without fertilization 1.2 dka
The fertilization is performed with 15 kg.dka-1 ammonium nitrate and 20 kg.dka-1 potassium superphosphate. After sowing and before germination, the culture was treated with the herbicide "Stomp" - 400 ml.dka-1. According to the period of growing season (125-130 days), used maize variety belongs to a group of 500 by FAO - medium late varieties. Plants reach a height of 240-260 cm, resistant to lodging, diseases and drought. The variety does not tillering [32].
The phenological studies of maize culture was conducted to receive a more complete picture of the complex plant - soil functional features in an urban environment. In the 8 test sites in both variants of culture, the percentage shares of phenophase were observed: seedlings, 1st leaf, 2nd leaf, 3rd leaf, 4th leaf, 5th leaf, 6th leaf, 7th leaf, 8th leaf, 9th leaf, 10th leaf, 11th leaf, 12th leaf, 13th leaf, panicle formation, silking, milk maturity, tasselling, wax maturity and physiological (full) maturity. Phenological development of nine weed species evolved in culture, was registered on 12 test sites in both variants. The percent participation of phenophases: spring, vegetation, budding, flowering, ripening of seeds and seed dispersal was calculated by the observations collection on the respective methodology [33]. The observations were carried out every 10 days during the growing season of cultivation. Based on observations, phenospectres were drawn about the timing of occurrence of phenophases and their duration for the culture and weed species in experimental variants. The characteristic of the timing of the occurrence of phenophases and their duration in a changing climate parameters is important to monitor the response of crops to these changes, changes in species competition and the effect on production. At the end of the growing season phytomass of maize from trial sites was collected, divided by factions, as: root, stem, leaves, panicle, wrapping leaves, curled, grain and cob. All of fractions were dried to absolute dry weight according to the methodology. The net production kg.ha-1 (a.d.w) was measured as well as the percentage shares of individual factions in the production in both variants [34,35].
In the period of mass flowering of weed species, the aboveground and underground phytomass from three sites was collected and weighed and the net annual production of weed species evolved in both variants was calculated [34,35].
The content of total N and crude protein in all factions of phytomass of maize for both variants are analysed by semiautomatic apparatus for distillation Buchi 321 in Common laboratory for protein analysis, the Biology Department.
The data are processed statistically [36]. The calculated statistical variables: arithmetic mean value - x, mean square deviation - S, coefficient of variation - CV, error of the mean value - Sx, confidence interval - Sx*t were calculated. The Student’s coefficient – t, probability at 0.050 was used. The ratio - x / Sx was estimated to verify the representativeness of mean values. They is considered as representative, if the ratio: x / Sx> t in the corresponding degrees of freedom and the perceived probability is true. The data are presented in tables and figures.
3. Results and Discussion
3.1. Characteristics of Soil
Morphological description, textural and chemical composition of the soil - Tables 2, 3 and 4
The diagnostic characteristics and properties are anthropogenic slightly leached Vertisol (FAO, 2006), gleyc, clay. The soil is characterized as very deep with a total capacity of the soil profile of 180 cm. The Vertisols are with meadow process on clay pliocene sediments. The soils are of hydromorphic origin, well-formed humus horizon, deep calcareous soils and presence of Fe-Mn concretions. In the area of experimental field, due to the drought during the period (27.07.2009 - 30-33°C) on the surface of the soil had opened cracks (peculiar to Vertisols) with 2-3 cm width and depth of holes 30-40 cm. The soil profile characterizes with presence of single large stones, probably carried forward and not reacting to HCl. Only the white belt in the area of B3k is limestone, strongly react to 10% HCl. Its origin is local; it stands as a dusty white line from limestone. The terrain description of soil profile is as follows.
Aorn. - 0-20 cm, dark brown to black, 10YR 4/4 (Munsell), fresh, slightly compacted, sandy-loamy, with crumby structure. The finely soil does not react to 10% HCl. Inclusions: single large stones, single very fine limestone flakes roots of grasses and traces of human activity in the form of various sized pieces of tiles and bricks. This shows that it is rather previous anthropogenic layer than natural soil horizon. The transition is clear for texture composition and density.
Ah - 20-42 cm, black and shiny with moisture, 10 YR 3/2 (Munsell), fresh, weak compacted to compacted, sandy-loamy to clay, with lumpy structure (with signs of prismatic depositions). The finely soil does not react to 10% HCl. Inclusions: chunks of bricks or stones. The transition unclear on textural structure, but clear in color.
AB - 42-63 cm, black at the bottom of the horizon with bright yellow to brown or sharp transition to the next horizon B1, 10 YR 3/3 on Munsell, fresh to moist, dense to very dense (the cord made of wet soil remains intact, not broken), clay, prismatic pattern that goes in retail slab. The finely soil does not react to 10% HCl. Inclusions: the whole horizon represents a mosaic with impurities of iron rust and yellow spots as large deposits or points and single large stones. The units are available with smooth glossy walls. There is a deposition from top to bottom from gray clay chutes (the sign of anaerobic environment). The transition is with dim color, rusty-brown or yellowish-brown.
B1 - 63-90 cm, dark-brown, 10 YR 5/4 (Munsell), damp, compacted, clay (the cord made of damp soil remains intact, not destroyed), very dense, with prismatic structure. The finely soil does not react to 10% HCl. Inclusions: single large stones. Features: with delluvial inclusions, white spots and yellow powder coatings by nests. The aggregates have smooth glossy walls. The transition is in ambiguous color, but clear on density.
B2 - 90-113 cm, brown to yellow-brown, 10 YR 5/4 (Munsell), humid to crisp, very dense, clay (the cord made of wet soil remains intact, not destroyed), with lumpy structure. The finely soil does not react to 10% HCl. Inclusions: with yellow powder illuvial inclusions and adhesion by nests or as spraying. Features: the surface of the aggregates have plenty of rusty-brown and yellow-brown iron oxides. The aggregates have smooth glossy walls. The transition is clear in color.
B3k - 113-140 cm, light brown, like a mosaic with white spots (white eyes) looks like spraying or yellow spots, 10 YR 7/3 on Munsell, wet, heavily compacted, clay (the cord made of wet soil remains intact, does not break) and greasy to the touch. The horizon passes in sandy loam at its lower end due to the proximity of B4 horizon, which is sandy, with wholesale lumpy to prismatic structure. Fine soils reacts strongly to 10% HCl - limestone horizon. Inclusions: mosaic in brown (dark) and white (of calcium). Features: a kind of bright limestone horizon, at a depth of 120-130 cm, which is the result of internal soil processes of washing and displacement. The transition is clear in color and structure.
B4 - 140-170 cm, light brown, 10 YR 5/6 (Munsell), damp to wet, loose, sandy (like clean sand with small white and yellow crystals), structureless. The finely soil does not react to 10% HCl. Features: with light or white patches and in depth - very rusty patches of iron oxides. Between B4 and B5/C horizon has a layer that looks like yellow rust belt of 3-4 cm, most likely from precipitating and accumulated iron oxides.
B5/S - 170 cm, gray-brown, typical of places with waterlogging and anaerobic environment (especially on marl or andesites), look like heavily destroyed clay rock with mosaic of yellow spots, 10 YR 6/3 (Munsell), damp to wet (probably the proximity of groundwater get influences) loose to slightly compacted, loamy sandy to sandy-clay (the cord breaks), structureless. The finely soil slightly reacts to 10% HCl. Inclusions: from Mn concretions and Fe oxides due to moisture that convey the character of less mosaics. Features: there is a gley formation process and plenty of Fe-Mn concretions.
Table 2. Textural compositions of soils in DEB.
| N | N % | Horizon, depth, cm | Moment moisture (at 27.07.2009), % | Hygroscopic moisture, % | Relative moisture |
| 1 | 0.851 | Аorn. 0-20 | 17.22 | 4.19 | 2.71 |
| 2 | 0.663 | Аh 20-42 | 17.50 | 4.06 | 2.39 |
| 3 | АВ 42-63 | 28.24 | 7.97 | 2.65 | |
| 4 | В1 63-90 | 27.76 | 6.86 | 2.57 | |
| 5 | В2 90-113 | 24.32 | 7.15 | 2.32 | |
| 6 | В3k 113-40 | 25.10 | 5.65 | 2.33 | |
| 7 | В4 140- 170 | 14.45 | 2.63 | 2.41 | |
| 8 | В5/С > 170 | 29.29 | 9.90 | 2.19 |
Table 2. Continued.
| N | N % | Horizon, depth, cm | Textural compositions, % | ||||||
| Losses from treatments with HCl | 2-0,25 mm | 0,25-0,05 mm | 0,05-0,01 mm | 0,01-0,005 mm | 0,005-0,001 mm | < 0,001 mm | |||
| 1 | 0.851 | Аorn. 0-20 | 1.88 | 6.25 | 41.87 | 16.67 | 12.50 | 4.16 | 16.67 |
| 2 | 0.663 | Аh 20-42 | 1.14 | 26.64 | 18.11 | 8.32 | 20.81 | 4.17 | 20.81 |
| 3 | АВ 42-63 | 0.65 | 16.95 | 0.33 | 17.28 | 25.91 | 12.96 | 25.92 | |
| 4 | В1 63-90 | 2.35 | 25.64 | 12.19 | 8.54 | 21.37 | 17.09 | 12.82 | |
| 5 | В2 90-113 | 0.96 | 15.22 | 15.22 | 21.44 | 12.86 | 17.15 | 17.15 | |
| 6 | В3k 113-40 | 5.60 | 19.98 | 19.45 | 16.92 | 16.91 | 8.46 | 12.68 | |
| 7 | В4 140- 170 | 0.92 | 65.20 | 5.13 | 12.32 | 4.11 | 4.11 | 8.21 | |
| 8 | В5/С > 170 | 1.32 | 4.73 | 28.02 | 30.37 | 13.58 | 8.79 | 13.19 | |
Table 3. Clay and sand content of soils in DEB.
| Horizon, depth, cm | Total coarse fractions >2 mm, % | Clay, % | Sand, % | Soil textural class |
| Аоrn. 0-20 | 0.79 | 35.21 | 64.79 | Mean sandy-loam |
| Аh 20-42 | 18.90 | 46.93 | 53.07 | Heavy sandy-loam |
| АВ 42-63 | 6.17 | 65.44 | 34.56 | Slightly loamy |
| В1 63-90 | 12.28 | 53.63 | 46.37 | Heavy sandy-loam |
| В2 90-113 | 3.78 | 48.12 | 51.88 | Heavy sandy-loam |
| В3k 113-140 | 0.36 | 43.65 | 56.35 | Mean sandy-loam |
| В4 140- 170 | 8.34 | 17.35 | 82.65 | Loamy-sandy |
| В5/С > 170 | 0.00 | 36.88 | 63.12 | Mean sandy-loam |
Table 4. Results for some chemical and water-physical properties of soils in DEB.
| № /horizon | Parameter | Unit | Methods | Results | |
| 1 | рH | ISO 10390 | Н2О | СаСl2 | |
| A оrn. 0-20 | 6.93 | 6.63 | |||
| А1 20-42 | 6.64 | 6.34 | |||
| АВ 42-63 | 6.34 | 5.91 | |||
| В1 63-90 | 7.42 | 7.11 | |||
| В2 90-113 | 7.02 | 6.95 | |||
| В3 113-140 | 8.02 | 7.76 | |||
| В4 140-170 | 8.01 | 7.69 | |||
| В5С 170-200 | 8.04 | 7.61 | |||
| 2 | Soil humus | % | Tjurin method | ||
| A оrn. 0-20 | 2.11 | ||||
| А1 20-42 | 1.89 | ||||
| АВ 42-63 | 0.82 | ||||
| В1 63-90 | 0.51 | ||||
| В2 90-113 | 0.17 | ||||
| В3 113-140 | 0.09 | ||||
| В4 140-170 | 0.07 | ||||
| В5С 170-200 | 0.09 | ||||
| 3 | Р2О5 | mg.100g-1 | ВВМ | ||
| A оrn. 0-20 | 27.56 | ||||
| А1 20-42 | 17.34 | ||||
| АВ 42-63 | 27.28 | ||||
| В1 63-90 | 9.01 | ||||
| В2 90-113 | 8.40 | ||||
| В3 113-140 | 13.52 | ||||
| В4 140-170 | 9.60 | ||||
| В5С 170-200 | 8.76 | ||||
| 4 | Bulk density | g.cm-3 | volumetric | ||
| A оrn. 0-20 | 1.42 | ||||
| А1 20-42 | 1.60 | ||||
| АВ 42-63 | 1.52 | ||||
| В1 63-90 | 1.61 | ||||
| В2 90-113 | 1.58 | ||||
| В3 113-140 | 1.51 | ||||
| В4 140-170 | 1.57 | ||||
| В5С 170-200 | 1.30 | ||||
| 5 | Full field water capacity | % | mm | ||
| A оrn. 0-20 | 43.53 | 117.44 | |||
| А1 20-42 | 23.90 | 82.44 | |||
| АВ 42-63 | 23.78 | 72.87 | |||
| В1 63-90 | 24.26 | 104.40 | |||
| В2 90-113 | 24.46 | 80.89 | |||
| В3 113-140 | 17.43 | 70.35 | |||
| В4 140-170 | 20.19 | 91.29 | |||
| В5С 170-200 | 21.21 | 81.89 | |||
| 6 | Moisture of permanent wilting | % | mm | ||
| A оrn. 0-20 | 10.11 | 27.28 | |||
| А1 20-42 | 11.59 | 39.98 | |||
| АВ 42-63 | 19.76 | 60.55 | |||
| В1 63-90 | 19.99 | 86.03 | |||
| В2 90-113 | 13.54 | 44.78 | |||
| В3 113-140 | 11.43 | 46.13 | |||
| В4 140-170 | 7.81 | 35.31 | |||
| В5С 170-200 | 22.17 | 85.60 | |||
The characteristics of soil in DEB include heavier texture, black color with resin tint and well formed humus horizon. According to these and other descriptive features, studied soil can be attributed to soil group "Vertisols" (FAO, 2006). Vertisols here are presented only type Smolnitsa that are quite peculiar and relatively recently described soils, considered by many authors as endemic soils in the Balkans. Some of the diagnostic characteristics of the studied Vertisols that distinguish them from other soils are: shrinkage and cracking over 2 cm of width in dry weather and swelling, when the weather is wet; overturning and displacement of surface mineral horizons; formation of glossy and shiny surfaces of aggregates (slickensides); high-ill in the horizons to 50-60 cm; a large amount of swelling clays (over 40% of fine soil); high density of soil aggregates of medium and deeper horizons; greater compactness of the clods with little or no any porosity. The climatic conditions, under which these Vertisols are formed, are very diverse, but Vertisols from different regions do not differ noticeably. Therefore, today's climate does not play a big role for the specific characteristics of these soils. They are more influenced by the warmer climate after the Pliocene conditions, when they were formed. Main role have the relief and soil formation materials. The soil formation rocks are represented by old-quaternary alluvium, alluvial and talus continental formations composed of limestone, marl, sands, clays, andesite. All of these products in the process of weathering and re-deposition are enriched with montmorillonite clay. The locations of studied soils are with low flat relief forms of the Sofia kettle field, in which there was an opportunity to get waterlogging. The soil formation processes in Vertisols have hydromorphic character. As justifications for what some relict signs of Smolnitsa are considered are powerful black humus horizon, the presence of carbonate subsoil, the presence of manganese nodule. Because of the loamy heavy texture and the dense structure of the soil profile during wet times of the year, the temporary anaerobic conditions are created. The morphological structure of the studied Vertisols is characterized by the soil profile of type ABC. The accumulated humus horizon is tick and well formed up to 63 cm, black to black tarry. In construction and structure, it consists in the upper part of an A horizon called Tilled (orn.) with crumby structure and slightly thickened. The lower part is composed of A1 and transitional horizon, AB horizon that are dense to very dense and prismatic structure. The humus-accumulative horizons gradually pass into transitional illuvial horizons B1 and B2, which are dark brown to reddish-brown, very dense and lumpy-prismatic structure. More than 113 cm are formed by soil forming materials, enriched with carbonates in the form of bright spots. Below, it is rich in marl subsoil (soil forming materials). In connection with the groundwater level and their impact on the bottom profile, the signs of gley process are visible. The texture of Vertisols is heavy (Table 1). The horizons at depths up to 140 cm have more uniform mechanical composition, often slightly loamy to heavy and medium sandy-loamy (Table 2). In depth the amount of sand fraction has doubled (to 83%) and soil forming materials pass into sandy loam. The Vertisols have a slight textural differentiation (the ratio of ill or clay fraction of illuvial horizons to the content of these fractions in the humus horizons, ie the texture ratio is not higher than 1.5). With respect to the degree of coarse fractions, soils are referred into the category of slightly skeletal soils - 20% of skeleton [12]. Related with heavy composition, the relative density or density of the solid phase of Vertisols is very high - reached 2.71 in surface horizons (Table 1). Accordingly, it is the smaller total porosity that fluctuates between 30 and 45% [10]. The porosity is strongly influenced by the textural composition and structure of the soil directly relate to the moisture regime of soils. It has a significant impact on processes (physical, chemical and biochemical) occurring in the soil. The heavy textural composition and other physical and mechanical properties of Vertisols (plasticity, stickiness, connectivity and hardness) make them difficult to process, both in wet and dry weather. The heavy textural composition of Vertisols determines the high value of basic hydrological indicators. The moisture content in the soil determined in the laboratory on 27.07.2009 by thermostat method [11], is higher for the clay horizon at a depth of 40 cm to 140 cm and is within the range between 24% and 28% (Table 1). The amount of hygroscopic moisture of the soil, i.e. moisture due to the absorbed water vapor from the air, depends a lot on the dispersity of the soil, respectively. The heavier mechanical composition of the transitional horizon and AB horizons determines higher amounts of hygroscopic moisture in them (from 6.86% to 7.97%).
The dynamics of soil water capacity during the growing season and energetic potential of soil moisture – Tables 5-8, Fig. 4-6
In both agrophytocenoses (plots I and II), the water supply is relatively low (Tables 5-8). This is more pronounced in the fertilized area. The dynamics per layers during the growing season is relatively synchronous to July in both fields. Especially the minimum in the water supply is determined. Then, its level increased in the individual layers of non-fertilized field and decreased in September, and again increased. The fertilized field showed similar dynamics is general characteristic of the soil layer 20-42 cm, while in other layers the water capacity remains relatively low with a tendency to gradually increasing (Fig. 4-6).
Table 5. Water capacity (mm) of soil layers in fertilized field during the growing season.
| Date/Soil layer | Water capacity, mm | |||
| 0 – 20 cm | 20 – 42 cm | 42 – 63 cm | 63 – 79 cm | |
| 2009-05-22 | 1.00 | 2.04 | 1.80 | 1.70 |
| 2009-06-06 | 4.30 | 4.08 | 4.18 | 4.38 |
| 2009-06-16 | 2.29 | 1.50 | 3.38 | 4.17 |
| 2009-06-26 | 24.74 | 34.05 | 29.68 | 24.37 |
| 2009-07-06 | 22.38 | 30.05 | 28.80 | 24.76 |
| 2009-07-16 | 21.00 | 27.49 | 32.08 | 24.09 |
| 2009-07-26 | 17.76 | 18.53 | 19.73 | 17.56 |
| 2009-08-05 | 17.45 | 29.82 | 33.28 | 29.89 |
| 2009-08-15 | 30.92 | 35.03 | 32.98 | 28.29 |
| 2009-08-25 | 17.37 | 26.55 | 26.39 | 23.80 |
| 2009-09-04 | 22.94 | 28.63 | 25.74 | 21.96 |
| 2009-09-14 | 15.65 | 23.15 | 26.78 | 24.29 |
| Mean | 16.48 | 21.74 | 22.07 | 19.11 |
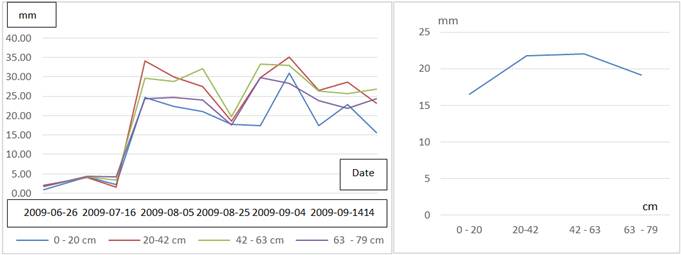
Fig. 3. Dynamics of water capacity (mm) in fertilized field: a) monthly per soil layers and b) average dynamics per soil layers.
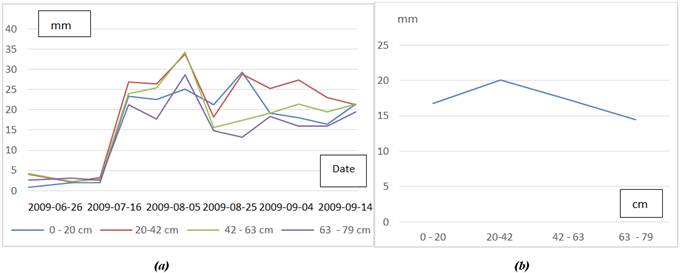
Fig. 4. Dynamics of water capacity (mm) in non-fertilized field: a) monthly dynamics per soil layers and b) average dynamics per soil layers.
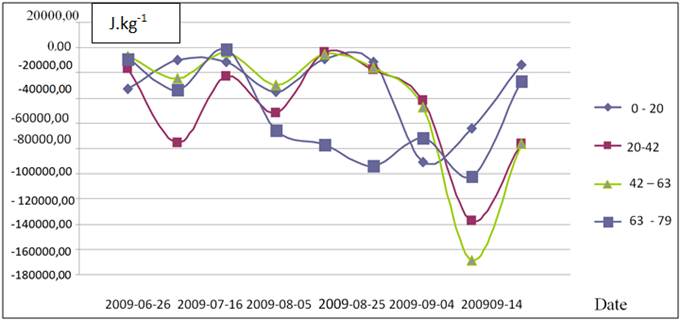
Fig. 5. Dynamics of soil moisture potential (J.kg-1) in fertilized field per soil layers (cm) during the growing season.
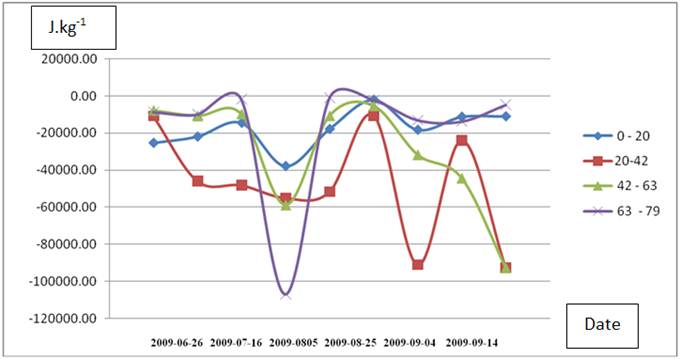
Fig. 6. Dynamics of soil moisture potential (J.kg-1) in non-fertilized field per soil layers (cm) during the growing season.
Table 6. Water capacity (mm) per soil layers in non-fertilized field during the growing season.
| Date/Soil layer | Water capacity, mm | |||
| 0 – 20 cm | 20-42 cm | 42 – 63 cm | 63 – 79 cm | |
| 2009-05-22 | 0,90 | 4,07 | 4,15 | 2,55 |
| 2009-06-06 | 2,00 | 2,16 | 2,26 | 3,13 |
| 2009-06-16 | 2,03 | 3,28 | 2,74 | 2,64 |
| 2009-06-26 | 23,37 | 26,81 | 24,03 | 21,19 |
| 2009-07-06 | 22,48 | 26,40 | 25,40 | 17,65 |
| 2009-07-16 | 25,05 | 33,81 | 34,19 | 28,71 |
| 2009-07-26 | 21,26 | 18,28 | 15,56 | 14,85 |
| 2009-08-05 | 29,35 | 28,78 | 17,35 | 13,16 |
| 2009-08-15 | 19,14 | 25,19 | 19,21 | 18,36 |
| 2009-08-25 | 17,99 | 27,31 | 21,42 | 16,00 |
| 2009-09-04 | 16,47 | 23,03 | 19,45 | 16,01 |
| 2009-09-14 | 21,41 | 21,20 | 21,48 | 19,55 |
| Mean | 16,79 | 20,03 | 17,27 | 14,48 |
Table 7. Soil moisture potential (J.kg-1) in non-fertilized field per soil layers during the growing season.
| Date/Soil layer | Water potential, J.kg-1 | |||
| 0 – 20 cm | 20-42 cm | 42 – 63 cm | 63 – 79 cm | |
| 2009-06-26 | -25299.49 | -10590.63 | -7672.45 | -8749.26 |
| 2009-07-06 | -21902.96 | -45798.42 | -10637.05 | -10023.34 |
| 2009-07-16 | -14503.97 | -48094.31 | -9603.90 | -1855.92 |
| 2009-07-26 | -37763.44 | -54980.41 | -58782.42 | -106942.48 |
| 2009-08-05 | -17834.41 | -51591.34 | -10606.19 | -951.93 |
| 2009-08-15 | -2139.75 | -10355.24 | -5156.51 | -2252.66 |
| 2009-08-25 | -18265.68 | -91111.14 | -31639.87 | -13047.56 |
| 2009-09-04 | -11290.67 | -23807.84 | -44324.41 | -13771.00 |
| 2009-09-14 | -11046.28 | -92815.11 | -92815.11 | -4808.97 |
Table 8. Soil moisture potential (J.kg-1) in fertilized field per soil layers during the growing season.
| Date/Soil layer | Moisture potential, J.kg-1 | |||
| 0 – 20 cm | 20-42 cm | 42 – 63 cm | 63 – 79 cm | |
| 2009-06-26 | -33049.61 | -16411.85 | -6783.08 | -8933.36 |
| 2009-07-06 | -10139.24 | -75790.87 | -24484.31 | -33360.46 |
| 2009-07-16 | -10966.69 | -22880.32 | -3952.24 | -1651.77 |
| 2009-07-26 | -35096.95 | -51880.11 | -29485.80 | -65474.49 |
| 2009-08-05 | -9328.95 | -3417.05 | -4872.75 | -76947.12 |
| 2009-08-15 | -11046.28 | -17154.97 | -16229.06 | -93716.42 |
| 2009-08-25 | -90715.69 | -42113.86 | -47179.42 | -71347.51 |
| 2009-09-04 | -64031.78 | -137566.57 | -168764.87 | -102366.27 |
| 2009-09-14 | -13596.05 | -76237.58 | -76237.58 | -26412.93 |
The soil invertebrates are important indicator for the features of soil and it’s fertility. The investigations of this group in spring on DEB area shows the total average density of 15.9 numbers per m2. The richness of young individuals is highest - 9.3 number per m2. The adult individuals refer to two genera – Eisenia and Lumbricus. The individuals from g. Eisenia prevail – 4.0 number per m2, while those of g. Lumbricus are with average density 2.6 n.m-2.
3.2. Species Composition of Secondary Natural and Cultural Vegetation – Table 9, Fig. 7 and 8
In field studies, 68 species of higher plants are described and identified. They belong to 22 families. Most represented families are Rosacea – 9 species, Asteraceae – 8 species and Poacea – 7 species (Table 9). The biological spectrum is dominated by perennial and annual species, and the life spectrum – by hemicryptophytes and terrophytes - Fig. 7.
Table 9. Species composition of DEB vegetation.
| № | Species | Biological type | Life form | Floristic element | Family | Anthropogenic status |
| 1 | Acer platanoides L. | tree | phanerophyte | subMed | Sapindaceae | apophyte |
| 2 | Achillea millefolium L. | perenial | chamaephyte | Eur-Sib | Asteraceae | apophyte |
| 3 | Ajuga genevensis L. | perenial | hemicriptophyte | SPont | Lamiaceae | apophyte |
| 4 | Alopecurus pratensis L. | perenial | hemicriptophyte | Eur-As | Poaceae | apophyte |
| 5 | Amaranthus blitoides Watson. | annual | therophyte | Adv | Amaranthaceae | anthropophyte |
| 6 | Aremonia agrimonoides (L.) DC | perenial | hemicriptophyte | subMed | Rosaceae | apophyte |
| 7 | Aristolohia clematitis L. | perenial | hemicriptophyte | Eur-Med | Aristolochiaceae | anthropophyte |
| 8 | Bellis perennis L. | perenial | hemicriptophyte | Eur-As | Asteraceae | apophyte |
| 9 | Capsicum annuum L. | annual | therophyte | Cultivate | Solanaceae | Cultivate |
| 10 | Chaerophyllum hirsutum L. | perenial | hemicriptophyte | subMed | Apiaceae | apophyte |
| 11 | Chamomilla recutita (L.) Rauscher | annual | therophyte | Eur-As | Asteraceae | anthropophyte |
| 12 | Cirsium arvense (L.) Scop. | perenial | therophyte | Eur-As | Asteraceae | anthropophyte |
| 13 | Clematis vitalba L. | shrub | phanerophyte | Eur | Ranunculaceae | apophyte |
| 14 | Convolvuls arvensis L. | perenial | hemicriptophyte | Kos | Convolvulaceae | anthropophyte |
| 15 | Cotoneaster integerrimus Medicus. | shrub | phanerophyte | Eur-Sib | Rosaceae | apophyte |
| 16 | Crataegus monogyna Jacq. | shrub | phanerophyte | subBoreal | Rosaceae | apophyte |
| 17 | Cucumis sativus L. | annual | therophyte | Cultivate | Cucurbitaceae | Cultivate |
| 18 | Cucurbita maxima L. | annual | therophyte | Cultivate | Cucurbitaceae | Cultivate |
| 19 | Cucurbita pepo L. | annual | therophyte | Cultivate | Cucurbitaceae | Cultivate |
| 20 | Dactylis glomerata L. | perenial | hemicriptophyte | Eur-As | Poaceae | apophyte |
| 21 | Datura stramonium L. | annual | therophyte | Adv | Solanaceae | anthropophyte |
| 22 | Daucus carota L. | annual-biannual | hemicriptophyte | Eur-As | Apiaceae | anthropophyte |
| 23 | Fragaria vesca L. | perenial | hemicriptophyt | subBoreal | Rosaceae | apophyte |
| 24 | Fraxinus excelsior L. | tree | phanerophyte | Eur-Med | Oleaceae | apophyte |
| 25 | Galinsoga parviflora Cav. | annual | therophyte | Adv | Asteraceae | anthropophyte |
| 26 | Hedera helix L. | shrub | phanerophyte | Eur-As | Araliaceae | apophyte |
| 27 | Heracleum sibiricum L. | perenial | hemicriptophyte | Eur-As | Apiaceae | apophyte |
| 28 | Hibiscus trionum L. | biannual | hemicriptophyte | Kos | Malvaceae | anthropophyte |
| 29 | Hordeum vulgare L. | annual | therophyte | Cultivate | Poaceae | Cultivate |
| 30 | Juncus conglomeratus L.. | perenial | hemicriptophyte | Eur | Juncaceae | apophyte |
| 31 | Lactuca sativa L. | annual-biannual | Hemicriptophyte | Cultivate | Asteraceae | Cultivate |
| 32 | Lamium purpureum L. | annual | therophyte | Eur-Med | Lamiaceae | anthropophyte |
| 33 | Lepidium sativum L. | annual | therophyte | Eur | Brassicaceae | anthropophyte |
| 34 | Ligustrum vulgare L. | shrub | phanerophyte | subMed | Oleaceae | apophyte |
| 35 | Lysimachia nummularia L. | perenial | chamaephyte | Eur | Myrsinaceae | apophyte |
| 36 | Mahonia aquifolium (Pursh) Nutt. | shrub | phanerophyte | Adv | Berberidaceae | anthropophyte |
| 37 | Malus domestica Borkh. | tree | phanerophyte | Cultivate | Rosaceae | Cultivate |
| 38 | Medicago sativa L. | perenial | hemicriptophyte | Adv | Fabaceae | Cultivate |
| 39 | Ornithogalum umbellatum L. | perenial | geophyte | Pont-subMed | Hyacinthaceae | apophyte |
| 40 | Phaseolus vulgaris L. | annual | therophyte | Cultivate | Fabaceae | Cultivate |
| 41 | Plantago lanceolatа L. | perenial | hemicriptophyte | Kos | Plantaginaceae | apophyte |
| 42 | Plantago major L. | perenial | hemicriptophyte | Boreal | Plantaginaceae | anthropophyte |
| 43 | Poa compresa L. | perenial | hemicriptophyte | Eur-subMed | Poaceae | apophyte |
| 44 | Populus pyramidalis Rozier. = Populus nigra L. var. italica Duroi | tree | phanerophyte | Eur-As | Salicaceae | anthropophyte |
| 45 | Prunus cerasifera Ehrh. | shrub-tree | phanerophyte | Eur-As | Rosaceae | anthropophyte |
| 46 | Prunus domestica L. | tree | phanerophyte | Hybr | Rosaceae | Cultivate |
| 47 | Pyrus comunis L. = Pyrus pyraster Burgsd. | tree | phanerophyte | subMed | Rosaceae | apophyte |
| 48 | Quercus frainetto Ten. | tree | phanerophyte | Eur | Fagaceae | apophyte |
| 49 | Ranunculus polyanthemos L. | perenial | geophyte | Eur-subMed | Ranunculaceae | apophyte |
| 50 | Ranunculus sardous Crantz. | annual | therophyte | Eur-Med | Ranunculaceae | apophyte |
| 51 | Raphanus sativus L. | annual-biannual | hemicriptophyte | Cultivate | Brassicaceae | Cultivate |
| 52 | Ribes nigrum L. | shrub | phanerophyte | Arct-Alp | Grossulariaceae | Cultivate |
| 53 | Rubus caesius L. | shrub | phanerophyte | Eur-As | Rosaceae | apophyte |
| 54 | Rumex acetosa L. | perenial | hemicriptophyte | Boreal | Polygonaceae | anthropophyte |
| 55 | Senecio vernalis Waldst. & Kit. | annual | therophyte | Eur-Med | Asterales | anthropophyte |
| 56 | Setaria italica L. (Beauv.) | annual | therophyte | subBoreal | Poaceae | apophyte |
| 57 | Solanum lycopersicum L. | annual | therophyte | Cultivate | Solanaceae | Cultivate |
| 58 | Solanum tuberosum L. | annual | therophyte | Cultivate | Solanaceae | Cultivate |
| 59 | Sorghum halepense (L.) Pers. | perenial | hemicriptophyte | subMed-As | Poaceae | anthropophyte |
| 60 | Taraxacum officinale L. | perenial | hemicriptophyte | Eur-Med | Asteraceae | apophyte |
| 61 | Tilia cordata Mill. | tree | phanerophyte | Eur | Malvaceae | apophyte |
| 62 | Triticum aestivum L. | annual | therophyte | Cultivate | Poaceae | Cultivate |
| 63 | Veronica persica Poir. | perenial | therophyte | Eur-As | Plantaginaceae | anthropophyte |
| 64 | Vicia cracca L. | perenial | hemicriptophyte | Eur-As | Fabaceae | apophyte |
| 65 | Vicia grandiflora Scop. | annual-biannual | hemicriptophyte | subMed | Fabaceae | apophyte |
| 66 | Viola hirta L. | perenial | hemicriptophyte | Eur-As | Violaceae | apophyte |
| 67 | Viola tricolor L. | perenial | hemicriptophyte | Eur-As | Violaceae | anthropophyte |
| 68 | Xanthium spinosum L. | annual | therophyte | Kos | Asteraceae | anthropophyte |
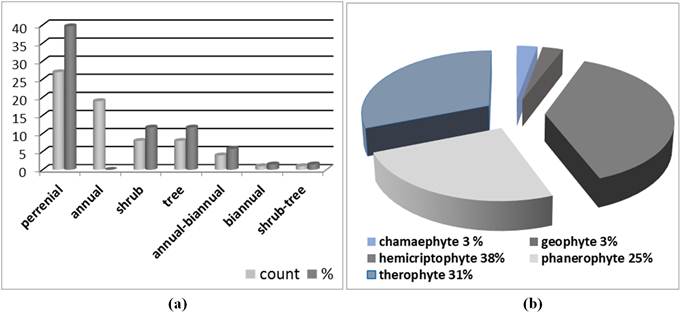
Fig. 7. Biological types (a) and life forms (b).
In the spectrum of geoelements, the Euro-Asian elements prevail, followed by cultivated species. The participation of European, euro-mediterranian and sub-mediterranian elements is similar. The participation of adventitious and cosmopolitan species is relatively high – Fig. 8 (a). Among the synantropic species, the apophytes group prevails, followed by the anthropophytes – Fig. 8 (b).
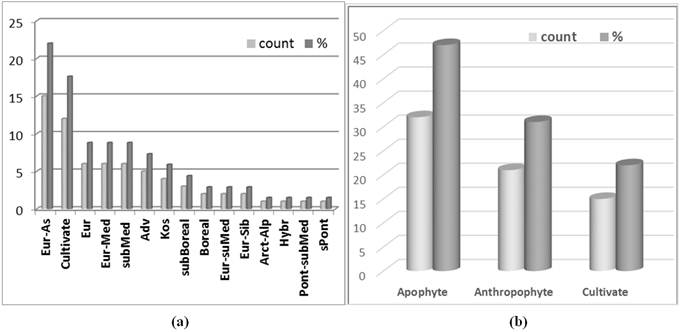
Fig. 8. Geoelements (a) and synantropic elements (b).
3.3. Phenological Development of Species in Maize Agrophytoceanoses
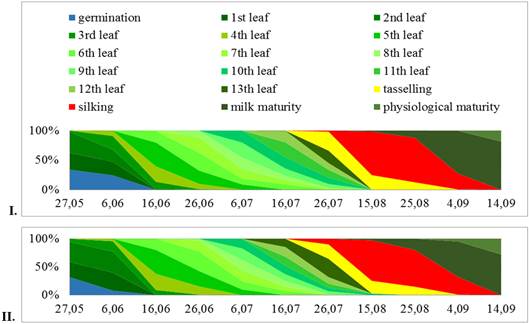
Fig. 9. Phenospectre of maize culture without fertilization (I) and with fertilization (II).
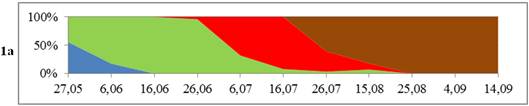
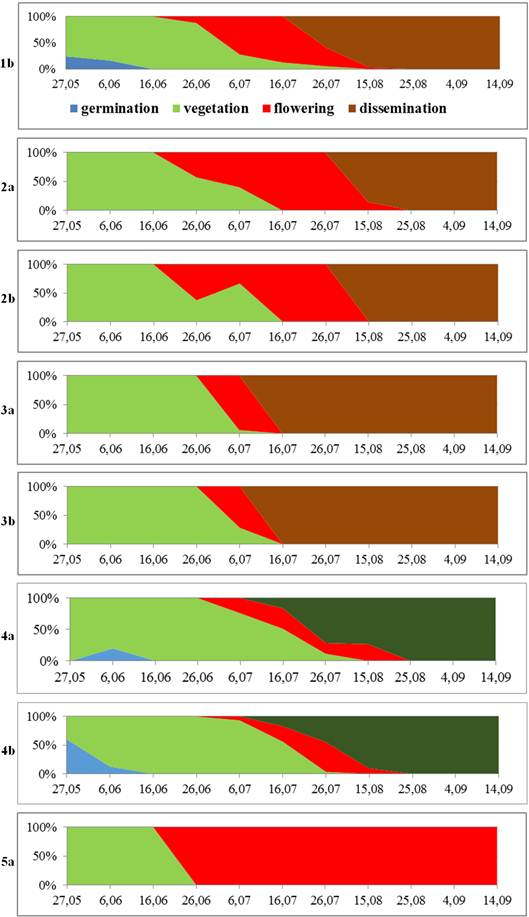
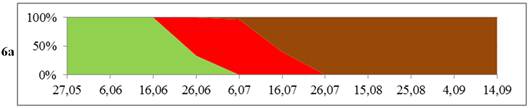
Fig. 10. Phenospectre of weed species: 1 - Amaranthus blitoides Watson.; 2 - Hibiscus trionum L.; 3 - Setaria italicа L. (Beauv.)/ Sorgum helepense (L.) Pers.; 4 - Xanthium spinosum L.; 5 - Convolvolus arvensis L.; 6 - Datura stramonium L.; a –non-fertilized field; b - fertilized field.
The phenological analysis conducted showed rapid onset of the vegetative phase in fertilized maize culture. For maize, the vegetative phase consists of many sub-stages requiring certain levels of water reserve. Certain differences are observed in the mass of individual sub-stages occurrence in the both experimental variants (Fig. 9).
In the DEB area, a total number of 14 species of weeds are described, while in maize agrophytocenoses –9 in nonfertilizide and only 6 – in fertilizide plot: Amaranthus blitoides Watson., Cirsium arvense (L.) Scop., Galinsoga parviflora Cav., Hibiscus trionum L., Setaria italicа L.(Beauv.), Sorgum helepense (L.) Pers., Xanthium spinosum L., Convolvolus arvensis L. and Datura stramonium L. Despite of the single treatment with «Stomp», the observed abundance of weeds is high. Depending on the method of cultivation (fertilization or not) the phenophase flowering occurs a month earlier at fertilization (plot II) for all of the observed weed species. The duration and the extent of mass occurrence of phenophases also vary specifically for each weed species, as shown in Fig. 10.
3.4. Primary Production and Content of Nitrogen and Crude Protein
The estimated average total production of Zea mays L., variety Kneja - 509 for the both agrophytocenoses (variants I and II) for vegetation period of 2009 in DEB was respectively 0.600 ± 0.063 and 1.075 ± 0.045 kg.m-2 a.d.w. (Table 10). The data obtained showed that due to the applied fertilization, the production has increased 1.8 times. In both variants of the productive capabilities are reported an average of 6.5 pc. m-2 corn plants. The variety has the best manifested productive capabilities while providing 4.5 to 6.5 pc.m-2 plants [21].
The participation of aboveground phytomass in the total production of maize varied from 84.17 to 92.74% respectively, in both variants - not fertilized and fertilized. The percentage of the roots ranged from 15.83 to 7.26%, respectively for the first and second variant, i.e. the proportion of root biomass in the total production of maize decreased 2.2 times to fertilized field. The estimated production of grain is within 0.139 ± 0.015 and 0.310 ± 0.017 kg.m-2 a.d.w. (variants I and II respectively), i.e. the fertilized crop yield of grain has increased 2.2 times. The weight of this fraction was increased from 27.52% to 31.1% of the total weight of the aboveground production due to the application of fertilization.
Table 10. Net production of of Zea mays L., variety Kneja - 509 in studied variants (kg.m-2.veg. period-1 a.d.w.).
| No. of plots | Aboveground production | Roots | Total | |||||||
| total | stems | leaves | panicles | Sheath leaves and silk | total | grain | cobs | |||
| Non-fertilized | ||||||||||
| 1 | 0.580 | 0.208 | 0.157 | 0.020 | 0.011 | 0.183 | 0.150 | 0.033 | 0.110 | 0.690 |
| 2 | 0.517 | 0.144 | 0.138 | 0.017 | 0.013 | 0.205 | 0.167 | 0.037 | 0.085 | 0.601 |
| 3 | 0.357 | 0.117 | 0.096 | 0.012 | 0.010 | 0.122 | 0.100 | 0.022 | 0.076 | 0.433 |
| 4 | 0.567 | 0.213 | 0.150 | 0.019 | 0.012 | 0.173 | 0.141 | 0.032 | 0.107 | 0.674 |
| x | 0.505 | 0.170 | 0.135 | 0.017 | 0.012 | 0.171 | 0.139 | 0.031 | 0.094 | 0.600 |
| S | 0.102 | 0.048 | 0.027 | 0.003 | 0.001 | 0.035 | 0.029 | 0.006 | 0.017 | 0.117 |
| CV | 0.010 | 0.002 | 0.001 | 0.000 | 0.000 | 0.001 | 0.001 | 0.000 | 0.000 | 0.014 |
| Sx | 0.026 | 0.012 | 0.007 | 0.001 | 0.000 | 0.009 | 0.007 | 0.002 | 0.004 | 0.029 |
| t | 2.132 | 2.132 | 2.132 | 2.132 | 2.132 | 2.132 | 2.132 | 2.132 | 2.132 | 2.132 |
| Sx*t | 0.055 | 0.025 | 0.015 | 0.002 | 0.001 | 0.019 | 0.015 | 0.003 | 0.009 | 0.063 |
| x/Sx | 19.752 | 14.299 | 19.808 | 19.808 | 34.961 | 19.513 | 19.513 | 19.513 | 22.650 | 20.439 |
| Fertilized | ||||||||||
| 1 | 0.924 | 0.210 | 0.299 | 0.0324 | 0.037 | 0.346 | 0.2764 | 0.0694 | 0.08002 | 1.004 |
| 2 | 0.935 | 0.201 | 0.2962 | 0.0321 | 0.046 | 0.361 | 0.2882 | 0.0724 | 0.08188 | 1.017 |
| 3 | 1.003 | 0.194 | 0.3058 | 0.0332 | 0.055 | 0.415 | 0.3317 | 0.0833 | 0.08747 | 1.090 |
| 4 | 1.125 | 0.2558 | 0.3631 | 0.0394 | 0.037 | 0.43 | 0.3435 | 0.0863 | 0.06514 | 1.190 |
| x | 0.997 | 0.215 | 0.316 | 0.034 | 0.043 | 0.388 | 0.310 | 0.078 | 0.079 | 1.075 |
| S | 0.092 | 0.028 | 0.032 | 0.003 | 0.009 | 0.041 | 0.033 | 0.008 | 0.010 | 0.085 |
| CV | 0.008 | 0.001 | 0.001 | 0.000 | 0.000 | 0.002 | 0.001 | 0.000 | 0.000 | 0.007 |
| Sx | 0.023 | 0.007 | 0.008 | 0.001 | 0.002 | 0.010 | 0.008 | 0.002 | 0.002 | 0.021 |
| t | 2.132 | 2.132 | 2.132 | 2.132 | 2.132 | 2.132 | 2.132 | 2.132 | 2.132 | 2.132 |
| Sx*t | 0.049 | 0.015 | 0.017 | 0.002 | 0.005 | 0.022 | 0.017 | 0.004 | 0.005 | 0.045 |
| x/Sx | 43.282 | 30.721 | 39.976 | 39.976 | 19.845 | 37.985 | 37.985 | 37.985 | 32.985 | 50.491 |
The reported average production of weeds phytomass varied from 0.298 ± 0.075 to 0.400 ± 0.123 kg.m-2 a.d.w. respectively for the first and second variant, i.e. average production increased 1.3 times in fertilized culture. The participation of aboveground phytomass ranged from 70.13% to 69.29%, respectively in the first and second variant, and the belowground - from 20.87% to 30.5%. Contrary to the "behavior" of the corn crop, the weed component increases belowground phytomass to capture better the mineral elements at fertilization. The calculated mean values of weed production and its fractions are representative and confirmed by a statistical analysis. In non-fertilized culture, Sorghum halepense (L.) Pers. and Xanthium spinosum L. dominate, participate respectively with 40% and 27.1% in the average production. Significant participation of Amaranthus blitoides Watson. and Setaria italica L. (Beauv.), respectively 14.54 and 12.75% and the least - of Hibiscus trionum L. with 4.81% is determined. In fertilized variant dominate species Xanthium spinosum L. (42.70%), Setaria italica L. (Beauv.) - 20,68% and Amaranthus blitoides Watson. (9.59%) (Fig. 11).
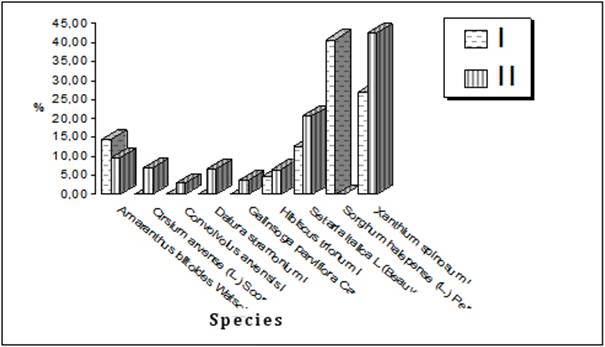
Fig. 11. Persent participation of weeds in total average production for I and II plot.
The total amount of net primary production of two variants was respectively 0.898 kg.m-2 and 1.475 kg.m-2 a.d.w. in both variants, and water content in this production is measured at respectively 1.511 kg.m-2 and 2.512 kg.m-2 a.d.w. The average ratio obtained between the dry phytomass and the water content is the same for both variants, respectively 37% and 63%.
Table 11. Content of nitrogen and crude protein (%) in fractions of maize phytomass in both variants.
| Sample | Total N | Crude protein acc. Keldal | ||
| I | II | I | II | |
| stems | 0.395 | 0.924 | 2.470 | 5.775 |
| leaves | 1.007 | 0.562 | 6.294 | 3.500 |
| grains | 1.467 | 1.091 | 9.100 | 6.800 |
| Cobs | 1.133 | 1.342 | 7.080 | 8.380 |
| Sheath leaves | 0.604 | 0.493 | 3.775 | 3.080 |
| paanicles | 0.952 | 0.674 | 5.950 | 4.213 |
| roots | 1.049 | 1.091 | 6.552 | 6.820 |
For qualitative characterization of the production, the nitrogen content and crude protein are studied (Tabl. 11). The nitrogen content is near and over 1% in most of the fractions. The highest content is established in the grains, and the lowest - in sheath leaves and stems. At applied fertilization, the reduction in the nitrogen content in almost all factions, but the increase in stems, cobs and roots was established. The crude protein content (Table 11) is the highest in the grain and cobs and the lowest - in stems, sheath leaves and silk. For phytomass of fertilized culture, the amount of crude protein increased mainly in stems and cobs. The calculated amount of nitrogen in the total production of maize is respectively 0.023 kg.m-2 and 0.010 kg.m-2 per veg. period, respectively at the first and second plot. At applied fertilization, the nitrogen content generally decreased in phytomass. The quantity of crude protein in production is also different in both variants of the experiment, respectively 0.035 kg.m-2 and 0.059 kg.m-2 per veg.period, i.e. the increase was determined, when fertilization is applied. The highest nitrogen content and crude protein is measured in the grain, leaves and stems. Due to the fertilization their relative content (%) increased mainly in the fractions of stems and cobs, while in leaves and roots –it is reduced. The calculated amount of nitrogen in grain decreased from 0.008 kg.m-2 in the first variant and 0.003 kg.m-2 - in the second one. Crude protein in the grain, however, increased from 0.013 to 0.021 kg.m-2, respectively.
4. Conclusion
The Vertisols are well stocked with soil nutrients and are considered as one of the most fertile soils in the country. On these soils can be produced a number of valuable crops - wheat, maize, barley, sunflower, cotton, alfalfa and others. These soils are less suitable for vegetables and fruits. It is better to add high doses of organic fertilizers and inert materials in order to improve their properties - fertilization with nitrogen and phosphorus fertilizers is recommended.
A high bulk density of the DEB Vertisols in the dry state is an indicator of low porosity, which in turn leads to deterioration of the aeration. In the absence of irrigation, the water capacity remains low in both studied variants. Because of the applied fertilizer the monthly dynamics of the water capacity is changed, which is generally lower during the growing period compared with non-fertilized field. The energetic potential of soil moisture is very low in both fields. The estimated potential in fertilized field is lower, compared to the non-fertilized.
The scheme of fertilization is very important for the dominant structure, phenology quantity, distribution and quality of primary production of urban crop vegetation.
The species richness of urban areas is in direct functional dependence of anthropogenic activity - pollution, agricultural and agromelioration activities. The research done at the plant complex of DEB showed that it still bears the scars of the local flora [22], albeit in quite an amended form – totally 66 higher species are described and the dominance of perennial species in the biological spectrum, the hemicryptophytes and terrophytes in the life spectrum, the Euro-Asian and synantropic species (mainly apophytes) in the spectrum of geoelements is obcerved. In agricultural areas, the weed species richness is influences by many factors, especially by the introduced schemes of fertilization and irrigation. Due to applied fertilization the greater weed species richness and higher competition between them are observed, which probably reflects on the water supplies and water potential. A possible reason may be the increased evapotranspiration. The total number of 14 species of weeds are described, while in maize culture, they are from 1.6 to 2.3 times less due to the single treatment with «Stomp» 9.
The phenological analysis conducted show rapid onset of the vegetative phase in fertilized maize culture and the certain differences in the vegetative sub-stages participation in the both experimental variants. The phenophase - flowering occurs a month earlier at fertilization for all of the observed weed species. The duration and the extent of mass occurrence of phenophases also vary specifically for each weed species.
The reported average production of maize and weeds phytomass increases respectively 1.8 and 1.3 times in fertilized culture. The participation of aboveground phytomass of maize slightly increases – 1.1 times and of belowground phytomass - 2.2 times decreases at fertilization, while the weed component at fertilization slightly dincreases the aboveground phytomass – 1.1 times and increases belowground phytomass - 1.5 times to capture mineral elements better than the culture do.
The dominant structure of weed species is also changed at fertilization. Sorghum halepense (L.) Pers. prevails in total weed biomass of fertilized plot, while in non-fertilized - Xanthium spinosum L.
The relative grain yield is within the norm - respectively 80% to 81.3% of the cobs weight in both studied variants.
The estimated amount of nitrogen in the total production of maize decreases, while this of crude protein increases at fertilization. The greatest nitrogen content and crude protein is established in the fractions of grain, leaves and stems. In the fertilized variant the relative content increases mainly in the fractions of stems and cobs, while in leaves and roots – it is reduced.
The indicators and indexes considered in the conducted model study are very sensitive to the cultivation practices and to the variation in the environmental factors. In the same time they are important characteristics of ecosystem functioning and they are widely used in the scientific investigations. However, their development as a complex application for the assessment of assets, capacity and potential of ecosystem services supplied from urban habitats is the originality of the study. They can also be applied to the urban habitats modeling and monitoring.
Acknowledgements
A part of research was performed with the financial support of National Scientific Fund under the project of Sofia University N025/2009/11"Studing the relation: production - energetic state of water status in agricultural ecosystems of Zea mays L. in Dragalevtzi Experimental Base", leaded by Prof. Dr. M. Lyubenova.
References


