| 1. | ||
| 2. | ||
| 3. | ||
| 3.1. | ||
| 3.2. | ||
| 4. | ||
| 5. | ||
The Transformation of the Chinese Economic Development Mode Promoted by Science and Technological Input
Lihui Li1, 2, Tao Wen2, *, Xiaohua Wang2, Da Liu2
1School of Mathematics and Statistics, Southwest University, Chongqing, China
2School of Economics and Management, Southwest University, Chongqing, China
Email address
 (Lihui Li)
  (Tao Wen)
  (Xiaohua Wang)
  (Da Liu)
 Citation
Lihui Li, Tao Wen, Xiaohua Wang, Da Liu. The Transformation of the Chinese Economic Development Mode Promoted by Science and Technological Input. International Journal of Economic Theory and Application. Vol. 3, No. 2, 2016, pp. 26-39.
Abstract
In this paper, a link between the science and technology input and the transformation of the mode of Chinese economic development has been established both theoretically and empirically. The theoretical research shows that the transformation of economic development mode is the evolution process of rationalization and optimization of the industrial structure. So the transformation of Chinese economic development mode is defined with the rationalization of industrial structure (RIS) and the optimization of the industrial structure (OIS). The social average profit rate makes the financial sector capital to eventually achieve the equilibrium allocation for each industry, and the rationalization will be realized on the basis of the optimization of the industrial structure. The evaluation index system of Chinese finance agglomeration degree (DFA) has been structured with the purpose of the DFA panel data and the model evaluation is conducted using data from China. The regional difference of the transformation of the Chinese economic development mode promoted by technological inputs with the regional DFA average level based on three HLM models have been explained. The conclusion exhibits that Chinese corporate inputs and the financial institutions loans included in the technological inputs failed to become the positive factor in the rationalization of industrial structure but did promote the optimization of the industrial structure. The human capital input and the government inputs only restrain the optimization of the industrial structure in 1995-2008. There are huge regional differences about the transformation of the economic development mode. The financial agglomeration is the significant cause leading to the differences and the differences will further increase about the transformation of the economic development mode. The financial agglomeration is the significant cause leading to the differences and the differences will further increase.
Keywords
Economic Development Mode, Science and Technology Input, HLM Model, Financial Agglomeration
1. Introduction
In this paper, the attempts to establish a model about the science and technology input and the transformation of the mode of economic development were made, both theoretically and empirically. Existing literature on related topics mainly focuses on the relationship of the science and technology input and economic growth. The research is conducted from a capital view.
Chinese economy has achieved remarkable achievement in the past 30 years since the adoption of reforming and opening policy. The average annual growth rate has been near to 10 percent excluding the price factor. However, the national economic development does not only depend on the economic size but also the more important optimization and upgrading of industrial structure. The changes of economic development mode directly determine the economic sustainability and it is the key variable to understand the differences between the developing and developed countries. Meanwhile it is the essential requirement of economic acceleration for developing countries [22]. There is no sustainable economic growth without the adjustment of industrial structure [16]. The Third Plenary Session of the 18th Central Committee of the CPC lays further stress on establishing the perfect marked-oriented technical innovation mechanism, the integration of science and technology planning and resource, the improvement of government support to the basic and strategic pioneering science research. How can Chinese abundant capital, including the enterprise capital, the government capital and financial capital, adapt the trend of industrial structure change and guide the rational resources allocation as well as increase investment in science and technology and promoting technological progress aimed at driving the optimization and upgrading of industrial structure and the change of economic development mode has been a crucial research topic.
The idea of technological change goes back to an earlier literature. Hicks [13] had already suggested that technological progress would economize on the more expensive factor. Related to Hicks’s idea, the late 1950s and early 1960s saw the emergence of an ‘induced innovation’ literature. In particular, Solow [21] analyzed quantitatively the role of technological progress on the economic growth based on the rate of technological change, the balance of the output growth that was deducted the contribution of the labor and capital. Arrow [3] studied the optimality of the resource allocation for inventions from the viewpoint of welfare economics. The former underlined the externality of the technology and the latter stressed the externality of the human capital. The research about the promotion of science and technology on economic development has been gradually deepened since 1990s. Xiaokai Yang and Borland [27] emphasied the important value of technological innovation in the analysis about the micro mechanism of economic growth. After that, Berman et al. [5] found that the two factors as measures of technical progress, the R&D expenditures and computer purchases, could account for as much as 70 percent of the move away from production to nonproduction labor over the period 1979-1987. Galor and Moav [10] showed that technology transformation, which brought about the differences of personal capability, often caused income inequality and was not conducive to the economic balanced growth. Jalles [14] interpreted the various per capita income growth rate with two different technological progress variants (patent and intellectual property index) based on the data of 73 countries from 1980 to 2005. It indicated that the technological progress would play an active role for the economic growth once the control of the endophytism. Jurica and Josip [15] positioned and measured the comprehensive effects of the technology to economy development since the first industrial revolution. Alani [2] studied the impact of the technological progress and productivity on the economic growth in Uganda from 1971 to 2009. The conclusion showed that the Ugandan economic growth was driven by the technological progress instead of the increase of the capital productivity and labor productivity.
Besides, the influence of the financial sector development on the industrial structure change has caused the appearance of a great number of literatures since 1960s. Ross Levine [22] explored the effects of the financial development to the industrial structure. Wurgler [26] and Fisman et al. [9] indicated that the efficiency of the financial capital allocation would promote the industrial development and the financial development would boost the adjustment of the industrial structure. Zouheir Abida et. al [28] examined the causal relationship between financial development and economic growth in a panel of three countries of North Africa. And they found a strong positive link between financial development and economic growth when alternative measures of financial development were used. They further also found that economic freedom is beneficial to growth, while democracy may have a small negative effect.
The literatures stated above provide this study the full reference theory and the advantageous logical beginning. The management measures and the system constructions of the developed countries on the promotion of the science and technology to economic development not only provide the important references but also present useful enlightenment with their successful experience. However, the models and experiences of the other countries are remarkably restricted by the circumstance of the Chinese economic development and the special conditions for the economic management and the business environment. Therefore, under the realistic background that the central government pays much attention to the science development and the innovation of the science and technology is devoted to solve a series of problems of unbalanced, uncoordinated and unsustainable development, the research, which is about the effects and practical results of the economic development mode’ changes caused by science and technology input, and the scientific demonstration, which is for the contributions of the science and technology to the amount and quality of economic development, is aimed at providing the decision-making basis for the governments at all levels formulating the policies which is about science and technology input and development as for acceleration of the transformation of economic development mode. Furthermore, it can provide the theoretical and empirical support for the vigorous promotion of the economic structure and modernization.
This paper is organized as follows. In Section 2, the theoretical model from the capital perspective based on the internal mechanism of the economic development mode’ change caused by the technological input will be introduced. Section 3 is an introduction about the data description and methodology. In Section 4, the empirical analysis is presented and Section 5 is a short conclusion.
2. Theoretical Model—Endogenous Mechanism of the Economic Development Mode’ Change
The concept of economic development is more comprehensive than economic growth as it defines a process that influences both growth and restructuring of an economy as well as the enhancement of the economic well being in a community. Generally, economic development encompasses three major aspects: economic growth, the optimization of economic structure and the improvement of economic quality. In this study, close attention has been paid to the change of economic development mode caused by science and technology input.
Considering the comprehension of the endogenous mechanism of the economic development mode’ change caused by science and technology input from the capital perspective, the hypotheses can be set as follows:
Hypothesis 1: The national major economies can be divided into three economic sectors: the financial sector (F sector), corporate sector (C sector) and government sector (G sector). The respective sectors will invest the science and technology due to the capital profit-driven and the technological innovation will be further triggered by the investment of the science and technology.
Hypothesis 2: The real economy consisted of the primary industry, secondary industry and tertiary industry, and the technological innovation lead to the adjustment of the industrial structure.
Hypothesis 3: The transformation of the economic development mode mainly refers to the optimizing of the industrial structure development, the development process of the industrial structure to the rationalization and optimization. Their definitions will be given in sector 3.
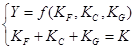
Hypothesis 4: In the condition of the fixed scale economy, the perfect market mechanism, the flexible social system, the free flow of the social resources among the industries and the optimal combination of the entity capital and the other elements including the labor, the transformation of the economic development mode mainly depends on the technological innovation driven by the technological input of the three sectors.
Based on the above hypotheses, further considering the labor applied with the capacity constraint [19], when certain resources are constrained the national production function from the capital view can be constructed as follows:
 (1)
(1)
Here![]() is the social total production,
is the social total production, ![]() ,
, ![]() and
and ![]() are the science and technological input of the finance sector, corporate sector and government sector respectively.
are the science and technological input of the finance sector, corporate sector and government sector respectively. ![]() is the total capital of the social technological input. Since the scale economy stays fixed and the real production function is linear as well as the capital is homogeneous,the real production function can be transformed as:
is the total capital of the social technological input. Since the scale economy stays fixed and the real production function is linear as well as the capital is homogeneous,the real production function can be transformed as:
![]() (2)
(2)
That is
![]() (3)
(3)
If ![]() ,
, ![]() ,
, ![]() , the real production function can be transformed as:
, the real production function can be transformed as:
![]() (4)
(4)
Taking partial derivative of (4) with respect to ![]() ,
, ![]() and
and ![]()
![]()
![]()
![]()
The above production functions fulfil the modalities and the properties of the neoclassical growth theory [21], so the following equations can be set up in the real production function fulfilling the above hypotheses:
![]() (5)
(5)
![]() (6)
(6)
![]() (7)
(7)
![]() (8)
(8)
![]() (9)
(9)
In equation (7), ![]() and
and![]() is each the capital output elasticity of the technology input from the corporate and government;
is each the capital output elasticity of the technology input from the corporate and government;![]() is the growth rate of the capital stock of the technology input from the financial sector; in equation (8),
is the growth rate of the capital stock of the technology input from the financial sector; in equation (8), ![]() is the percentage of the incremental capital in the real total production for the corporate technology innovation; in equation (9),
is the percentage of the incremental capital in the real total production for the corporate technology innovation; in equation (9), ![]() is the percentage of the incremental capital in the real total production for the government technology innovation.
is the percentage of the incremental capital in the real total production for the government technology innovation.
The equations (8) and (9) show: Keeping fixed ![]() ,
, ![]() and
and![]() , which is the economic stable growth, the capital allocation of the technology input from the financial, corporate and government will achieve the warranted rate
, which is the economic stable growth, the capital allocation of the technology input from the financial, corporate and government will achieve the warranted rate ![]() (if
(if ![]() and
and ![]() ). From the equation (5)-(7),
). From the equation (5)-(7), ![]() if
if ![]() and
and ![]() are the warranted rates, and this is that the real production and the capital stock of the technology input from three sectors will increase with the same rate. Meanwhile the capital-guidance industrial structure is the rationalization status and then the macro-economy achieves the steady growth.
are the warranted rates, and this is that the real production and the capital stock of the technology input from three sectors will increase with the same rate. Meanwhile the capital-guidance industrial structure is the rationalization status and then the macro-economy achieves the steady growth.
In accordance with the demand-following or supply-leading theory [18], the changes of the consumption structure will induce the industrial technology innovation and transformation of the industrial supply structure. The transformation of the industrial structure will lead to the turning of the capital input structure and the capital input must further spur the technological innovation thereupon then promote the transformation of the industrial structure. It indicates that the social resource will flow to the technological innovation sector in the transformation of economic development mode, and the rationalization of industrial structure is that the capital allocation structure in all economic sectors must therewith make an adjustment. On the other hand, the optimal transformation of the economic development mode should meet the requirement of structure rationalization of the most basic industries and promote the industrial coordinated development, and meanwhile the capital allocation of the social agriculture, industry and service is the warranted rate [24]. Actually in the absence of the perfect competition and unexpected impact including the system, the adjustment process of the capital warranted proportion for the science and technology input in three economic sectors would realize through the average social profit rate law. The return on investment determines the capital allocation process in every sector. If ![]() ,
, ![]() and
and ![]() is each the average social profit rate of the financial, corporate and government, and
is each the average social profit rate of the financial, corporate and government, and![]() is the average social profit rate, only when
is the average social profit rate, only when ![]() , the capital allocation of every sector to technological innovation would be relatively stable. Meantime the capital allocation structure is with the optimal state and the promotion effect of the science and technology to the economy is optimal, and then the economy is with the optimal growth state, so the corresponding industrial structure is the most rational one.
, the capital allocation of every sector to technological innovation would be relatively stable. Meantime the capital allocation structure is with the optimal state and the promotion effect of the science and technology to the economy is optimal, and then the economy is with the optimal growth state, so the corresponding industrial structure is the most rational one.
The above indicates that the consumption structure is the source of the change of the entity industrial structure. The changes of consumption structure induce the technology innovations of the related industries and the technology innovations trigger the changes of the profit rates in every industrial sector. And the changes of the profit rates will further evoke the capital transformations of the technology input in every sector as well as the capital inputs will play the roles of boosting to the technology innovation. When the capital flows into the industry and service sectors from the agriculture sector, the technology innovation is promoted and the industrial structure adjustment is accelerated. The capital equilibrium allocation will ultimately achieve for all sectors in the effect of the average social profit rate, which is the rationalization of the industrial structure. With the technology innovation is endless, the effect and the adjustment of capital to the industry is endless. Only there is the technology innovation in an industrial sector, which will result in the change of the profit rate, the capital flow in every industry would start again. Therefore the industrial structure transformation which is spurred by the technology innovation and capital is the interminable process.
3. Data Description and Methodology
3.1. Variable Description
The relevant variables are described as follows.
The industrial structure change of an economy have two dimensions based on dynamic perspective: The rationalization of industrial structure (RIS) and the optimization of the industrial structure (OIS). The change of industrial structure can be measure by the two dimensions.
The RIS, coupling quality of industrial cluster, reflects the degree of industrial coordination and the degree of the utilization of resources. Commonly, it is measured by departure degree of structure and can be computed as follows:
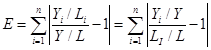 (10)
(10)
Here, ![]() is departure degree of structure,
is departure degree of structure, ![]() is output value,
is output value, ![]() is employment,
is employment, ![]() is industry,
is industry, ![]() is industrial sector number. According to classical economics hypothesis,long-run equilibrium naturally emerges and the diverse industrial sectors have the same productivity.
is industrial sector number. According to classical economics hypothesis,long-run equilibrium naturally emerges and the diverse industrial sectors have the same productivity. ![]() is productivity with its definition, and then, when there are economy equilibria,
is productivity with its definition, and then, when there are economy equilibria, ![]() , so,
, so, ![]() .
. ![]() is output structure and
is output structure and ![]() is employment structures,hence,
is employment structures,hence, ![]() measures the coupling between the output and employment structure. The larger
measures the coupling between the output and employment structure. The larger![]() means more deviation of economy from the equilibrium and more unreasonable industrial structure. On account of non-equilibrium economy is a normalcy and especially the case in developing countries [22],
means more deviation of economy from the equilibrium and more unreasonable industrial structure. On account of non-equilibrium economy is a normalcy and especially the case in developing countries [22], ![]() is ineluctability. Ignoring the importance of various industries, departure degree index of structure makes all industries no exception and the absolute value brings the compute inconvenience. Considering the above, Gan Chunhui, Zheng Ruogu and Yu Dianfan [11] made the redefine with the Theilindex [23] as follows:
is ineluctability. Ignoring the importance of various industries, departure degree index of structure makes all industries no exception and the absolute value brings the compute inconvenience. Considering the above, Gan Chunhui, Zheng Ruogu and Yu Dianfan [11] made the redefine with the Theilindex [23] as follows:
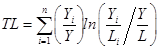 (11)
(11)
Similarly, ![]() if economy is equilibrium. The index considers the relative importance and avoiding the compute of absolute value as well as retaining the theoretical basis and economy economic meaning, therefore it is the better measure of the RIS. RIS is equal to TL, and
if economy is equilibrium. The index considers the relative importance and avoiding the compute of absolute value as well as retaining the theoretical basis and economy economic meaning, therefore it is the better measure of the RIS. RIS is equal to TL, and ![]() indicate the industrial structure diverge the equilibrium states and the industrial structure is unreasonable.
indicate the industrial structure diverge the equilibrium states and the industrial structure is unreasonable.
The OIS measures the upgrade of industrial structure. The general literatures measure the upgrade the industrial structure with proportion of non-agriculture industry according to Petty-Clark’s law. However, the traditional way of measurement cannot reflect the trend of the economic structure. Because the service of economic structure is the important features of industrial structure upgrading, we measure the OIS with the ratio of the output value of the third industry and the total output values which is the sum of the first industry and the second industry. The measure can reflect clearly the service inclination of economic structure. If it is on the rise, economy is pushed to service orientation and industrial structure is upgrading. It can be computed as follows:
![]() (12)
(12)
Here ![]() and
and ![]() are respectively the outputs value of the first industry and the secondary industry.
are respectively the outputs value of the first industry and the secondary industry. ![]() is the output value of tertiary industry (including the high-tech industry output value).
is the output value of tertiary industry (including the high-tech industry output value).
Theoretical analysis from section 2 provides us the selection approach of the independent variables. The involved independent variables can be described as:
![]() : the proportion of the practitioners of the high-tech industry in the total employment
: the proportion of the practitioners of the high-tech industry in the total employment
![]() : the proportion of the government input in the total production value of the high-tech industry
: the proportion of the government input in the total production value of the high-tech industry
![]() : the proportion of the corporate input in the total production value of the high-tech industry
: the proportion of the corporate input in the total production value of the high-tech industry
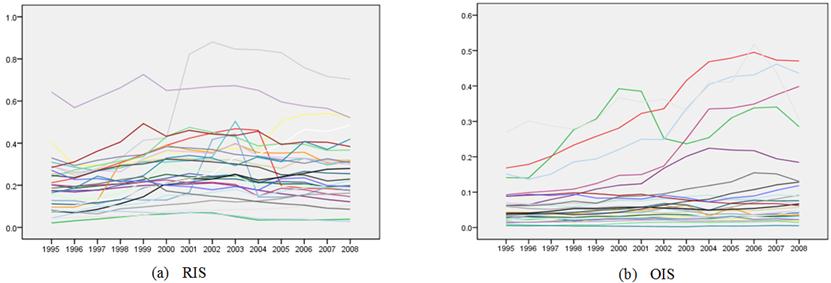
Figure 1. The Changes of The RIS and The OIS in china 1995-2008.
![]() : the proportion of the financial institutions loan in the total production value of the high-tech industry
: the proportion of the financial institutions loan in the total production value of the high-tech industry
To analyze the growth effects of industrial structure change, we employ a panel data set of 30 provinces China, and data series span 1995-2008. Data is drawn from the China Statistical Yearbook and China Statistical Yearbook On High Technology Industry. Figure 1 indicates the change tendencies of industrial structure China 1995-2008 and shows that RIS and OIS have different clear growing tendencies in various provinces. The provinces with the higher initial value have slow growth in the early period and the downward trends in about 2002 from figure![]() . The provinces with the lower initial value have slow growth in the early stage, but the huge growth in about 2001 and tending to be stationary thenceforth. Figure
. The provinces with the lower initial value have slow growth in the early stage, but the huge growth in about 2001 and tending to be stationary thenceforth. Figure ![]() shows that the provinces with the higher initial OIS have the faster and greater growth and the provinces with the lower initial OIS have quite slow and more stationary growth.
shows that the provinces with the higher initial OIS have the faster and greater growth and the provinces with the lower initial OIS have quite slow and more stationary growth.
3.2. Methodology
Many kinds of data, including observational data collected in the economic fields, have a hierarchical or clustered structure. For example, human studies of inheritance deal with a natural hierarchy where offspring are grouped within families. Some variables describe the characteristics of the individual (offspring) and others describe the characteristics of the groups (families). In the hierarchy as consisting of units grouped at different levels, offspring may be the level 1 unit in 2-level structure where the level 2 units are the families.
Considering every individual with various intercepts and slopes as sampling from different samples in simple regression model, it is a hierarchical model or random coefficient model. More, it is a hierarchical linear model (HLM) if the relation between variables is linear [7]. The coefficients of model, variance component and covariance component can be generally estimated by Iterated Generalized Least Squares (IGLS), Restricted Iterated Generalized Least Squares (RIGLS), Restricted maximum likelihood (RML), Bayesian Method, Markov Chain Monte Carlo (MCMC) and Bootstrapping Method. Estimations in diverse method are efficient and consistent under the normality assumption and the larger sample size. As the expanding of classical variance analysis,Raykov, T. and Zinbarg, R. E. [20], Elly, et al. [8] carried on some further research and got lots of results.
There are a large number of applications with the HLM in social science fields, but few research pays attention to its economic panel data application. The sources of variation of panel data include the variations within groups, the variations between groups and the interregional variations varying with time. In the conventional repeated measures analysis of variance, it is a basic assumption that there are same residual variances and covariance are constants. The assumption is difficult to set up in many economic panel data, so its actual application is restricted.
Hierarchically structured data occurs when the same individuals or units are measured in more than one occasion. Our research considers the growth of the RIS and the OIS. Here the occasions are clustered within individuals that represent the level 2 units with measurement occasions the level 1 units. Our modeling frameworks are:
Level 1
![]() (13)
(13)
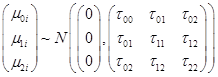
Level 2 ![]()
![]()
![]()
![]()
![]()
![]()
![]()
Level 1
![]() (14)
(14)
Level 2 ![]()
![]()
![]()
![]()
![]()
![]()
![]()
in which ![]() indexes the province and
indexes the province and ![]() denotes time. The variables involved are as what described above. The model (13) and model (14) have almost the same frame work, therefore we only discuss the model (13). In the model (13), level 1 is the model of different provinces in each year. The explanatory variables in level 1 are centered at the group mean. It means the differences between the explanatory variables of the
denotes time. The variables involved are as what described above. The model (13) and model (14) have almost the same frame work, therefore we only discuss the model (13). In the model (13), level 1 is the model of different provinces in each year. The explanatory variables in level 1 are centered at the group mean. It means the differences between the explanatory variables of the ![]() th province in
th province in ![]() th year and their average level in all years. Considering the intercept firstly,
th year and their average level in all years. Considering the intercept firstly, ![]() is initial value of the RIS of the
is initial value of the RIS of the ![]() th province, which is initial status in 1995. Level 2 is for the country as the whole, in which
th province, which is initial status in 1995. Level 2 is for the country as the whole, in which ![]() denotes the average initial value of the national RIS.
denotes the average initial value of the national RIS. ![]() is the random error between groups, which is from the differences of the provinces. Same argument for the slope
is the random error between groups, which is from the differences of the provinces. Same argument for the slope ![]() , it denotes the instantaneous growth rate of the RIS of the
, it denotes the instantaneous growth rate of the RIS of the ![]() th province in 1995. The growth rate of every province is the sum of the national total growth rate and the random errors between groups, which can be shown by equation
th province in 1995. The growth rate of every province is the sum of the national total growth rate and the random errors between groups, which can be shown by equation ![]() .
. ![]() and
and ![]() are the fixed effects as well as
are the fixed effects as well as ![]() and
and ![]() are the random effects.
are the random effects. ![]() denotes the accelerations of each growth trajectories. Though the acceleration is the characteristic of the whole trajectory, the initial state and the instantaneous rate is dependent on the special value for the time.
denotes the accelerations of each growth trajectories. Though the acceleration is the characteristic of the whole trajectory, the initial state and the instantaneous rate is dependent on the special value for the time. ![]() ,
, ![]() , indicate the RIS’s the relative change rate of the diverse explanatory variables in the
, indicate the RIS’s the relative change rate of the diverse explanatory variables in the ![]() th province. The main difference in the model (14) is that the growth rate can be simplified as only the random effect excluding the fixed effect.
th province. The main difference in the model (14) is that the growth rate can be simplified as only the random effect excluding the fixed effect.
The error term in model (13) is assumed to be normal distribution and the error term of the model (14) can be similarly explained:
![]() ,
, 
In addition, the random error in level 1 is assumed to be independent of the random error in level 2, besides, all the errors are independent of the predictive variable in the model. If the ![]() , the
, the ![]() and the
and the ![]() , variance of the random intercept and the variances of the random slope and the acceleration in the level 1, are not significantly equal to 0, the initial states, the growth rate and the acceleration in the provinces have differentia due to the existence of regional differences. The hierarchical model reflects the differences of RIS and OIS at different times and in various provinces, which are affected by the provincial and interprovincial errors. We assume that the coefficients of the
, variance of the random intercept and the variances of the random slope and the acceleration in the level 1, are not significantly equal to 0, the initial states, the growth rate and the acceleration in the provinces have differentia due to the existence of regional differences. The hierarchical model reflects the differences of RIS and OIS at different times and in various provinces, which are affected by the provincial and interprovincial errors. We assume that the coefficients of the ![]() ,
, ![]() ,
, ![]() and
and ![]() have no interprovincial differences and provincial differences*.
have no interprovincial differences and provincial differences*.
Based on the model presented above, considering explanation to regional difference of growth effect of RIS and OIS we divide all the provinces into three major areas according to the regional division in the China Statistical Yearbook: east, central and west. So the new model frameworks are:
Level 1
![]() (15)
(15)
Level 2 ![]()
![]()
![]()
![]()
![]()
![]()
![]()
Level 1
![]() (16)
(16)
Level 2 ![]()
![]()
![]()
![]()
![]()
![]()
![]()
in which dummy variables are:
![]() ,
, ![]()
![]() denotes the average initial value of the RIS in west area while
denotes the average initial value of the RIS in west area while ![]() denotes the differences of the average value between the east and the west in 1995.
denotes the differences of the average value between the east and the west in 1995. ![]() can does the same explanation. The argument of the slope
can does the same explanation. The argument of the slope ![]() and
and ![]() is the same as above.
is the same as above.
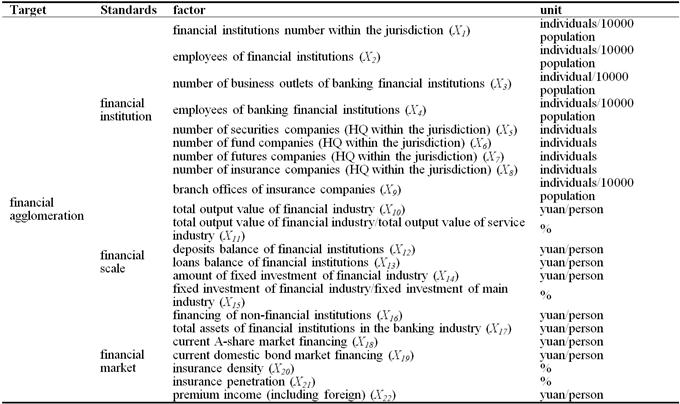
Considering the explanation of the regional differences of growth rate and the acceleration, based on the fact that the financial agglomeration can promote the economic growt [4], degree of financial agglomeration (DFA) is set to be the explanatory variable for the growth rate and acceleration of the RIS and OIS caused by the science and technology input. Baldwin and Martin consider the growth effect of the financial agglomeration to the core areas and its radiation effect to the marginal areas with the LS model. Cook and Gary [6] research the effects of the knowledge creation and diffusion based on the financial services agglomeration view. The findings above provide the beneficial inspiration for this research. Being different from other industrial agglomeration, the financial agglomeration is not only the spatial agglomeration of the financial service industry but also the agglomeration of the capital supply and economic radiation effect. For the evaluating the degree of the financial agglomeration as a whole, we construct the evaluation index system from the aspects of the financial institution, the financial scale and the financial market. The evaluation index system for the degree of the financial agglomeration is divided into three levels: Target level (the financial agglomeration), standard level (the financial institution, the financial scale and the financial market) and factor level. Each criterion levels include several specific factors. The detailed index is presented in the attached table 1. We compute the DFA by the principal components analysis and have the panel data. The data comes from the China Statistical Yearbook, Statistical Yearbook of each region, Financial Operation Report and the web site of the expatriate management mechanism of the PBC. After stabilizing and centralizing the DFA, we averaged the data for the description of the regional states in fourteen years. Consequently the data which reflects the regional financial agglomeration in level-2 can be acquired and centered at grand mean. The modified models are as follows:
Level 1
![]() (17)
(17)
Level 2 ![]()
![]()
![]()
![]()
![]()
![]()
![]()
Level 1
![]() (18)
(18)
Level 2 ![]()
![]()
![]()
![]()
![]()
![]()
![]()
There the slope ![]() indicates the marginal effect of the DFA on the growth rate and acceleration of the RIS cause by the science and technology input. The slope
indicates the marginal effect of the DFA on the growth rate and acceleration of the RIS cause by the science and technology input. The slope ![]() indicates the marginal interactions of the DFA and inputs. Some variables in level-1 are not needed to be explained by the DFA due to its no significant. The explanation of the coefficients in model (18) is the same as the one demonstrated above.
indicates the marginal interactions of the DFA and inputs. Some variables in level-1 are not needed to be explained by the DFA due to its no significant. The explanation of the coefficients in model (18) is the same as the one demonstrated above.
4. Empirical Results and Discussions
In this section, we analyze the growth rates of the RIS and OIS for the time period and range of provinces in our data set based on the theoretical model. At the same time, the empirical supports are provided for the comparison of their regional differences.
CHIPCT, theoretical values from a ![]() with
with ![]() being the number of random factors, and MDIST, Mahalanobis distance under the normality assumption which should be approximately
being the number of random factors, and MDIST, Mahalanobis distance under the normality assumption which should be approximately ![]() with
with ![]() being the number of random factors, should be a 45 degree line under the assumption of normality at level-2. The normality assumption of error term related directly to the estimation of confidence interval. Figure 2 character the normal Q-Q of CHIPCT against MDIST for RIS and OIS in Level 2 from model (13) and (14). The normality assumption of sample is supports the result from being approximate straight line.
being the number of random factors, should be a 45 degree line under the assumption of normality at level-2. The normality assumption of error term related directly to the estimation of confidence interval. Figure 2 character the normal Q-Q of CHIPCT against MDIST for RIS and OIS in Level 2 from model (13) and (14). The normality assumption of sample is supports the result from being approximate straight line.
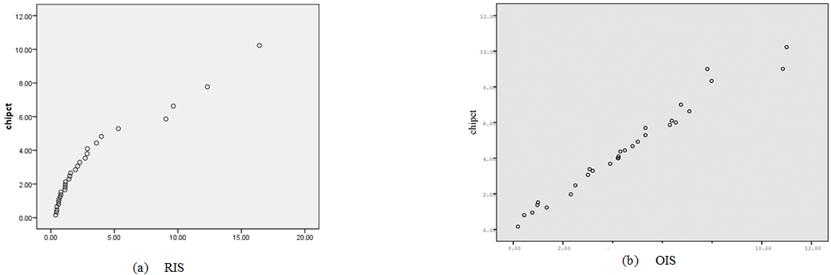
Figure 2. The Q-Q Plot of CHIPCT against MDIST for RIS and OIS In Level 2.
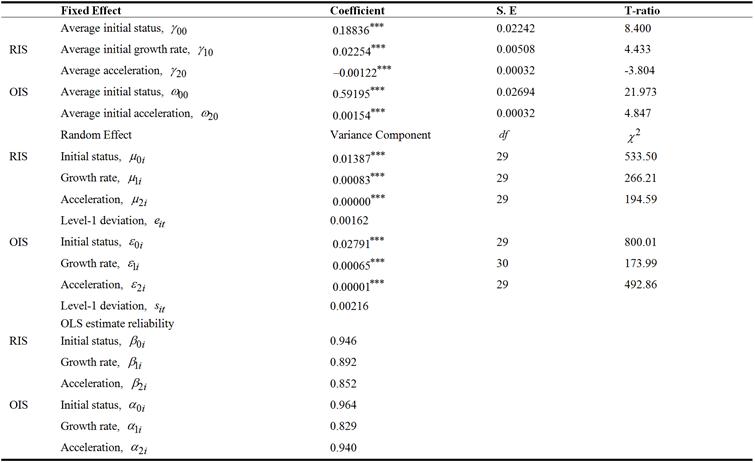
Considering the bias estimate due to the IGLS in the given small sample size and the adjusting of the RML algorithm for the estimate of variance-covariance components to the fixed effect’s uncertainty, we estimate the model to obtain the unbiased estimate by the RML. Table 1 indicates that the data supports the basic HLM model. For the HLM model, the variance-covariance estimate based on the RML method can be only expressed with numerical calculation instead of the function calculation. The estimate average intercept ![]() and
and ![]() , which shows that the average initial values of RIS and OIS are 0.18836 and 0.59195 units. The average growth rate in 1995
, which shows that the average initial values of RIS and OIS are 0.18836 and 0.59195 units. The average growth rate in 1995 ![]() , which shows that the RIS in the provinces goes up with the 0.02254 units rates in 1995. The acceleration (
, which shows that the RIS in the provinces goes up with the 0.02254 units rates in 1995. The acceleration (![]() ) is negative and highly significant, which indicates that the growth rate of RIS decreases constantly with the time. In general,
) is negative and highly significant, which indicates that the growth rate of RIS decreases constantly with the time. In general,
![]() (19)
(19)
so the RIS goes up with a rate of 0.01034 units each year in 2000![]() and the average growth rate has averaged out at -0.00186 units each year in 2005.
and the average growth rate has averaged out at -0.00186 units each year in 2005.
The standard deviation of the individual observed value of the RIS compare to the growth curve is ![]() units. For the fixed effect and random effect of RIS and OIS, their t-value is big enough, which indicates that the parameters are necessary for ascribing of average growth trajectories. The following study focuses on the dispersion between the individual growth trajectories and average curve. For the individual growth parameters,
units. For the fixed effect and random effect of RIS and OIS, their t-value is big enough, which indicates that the parameters are necessary for ascribing of average growth trajectories. The following study focuses on the dispersion between the individual growth trajectories and average curve. For the individual growth parameters, ![]() ,
, ![]() ,
, ![]() ,
, ![]() ,
, ![]() and
and ![]() their variance estimations are 0.01387, 0.00083, 0.00000, 0.02791, 0.00065 and 0.00001. There are so big
their variance estimations are 0.01387, 0.00083, 0.00000, 0.02791, 0.00065 and 0.00001. There are so big ![]() -value with regard to null hypothesis that the null hypothesis of homogeneity test can be refused. So the RIS and the OIS in various provinces exist the significant initial differences in 1995 and their growth rate exist the significant differences.
-value with regard to null hypothesis that the null hypothesis of homogeneity test can be refused. So the RIS and the OIS in various provinces exist the significant initial differences in 1995 and their growth rate exist the significant differences.
The reliability of the individual growth parameters can be presented. The total variation of the OLS estimates in level 1 includes the error variance and parameter variance, which can be written:
![]() (20)
(20)
in which  ,
,  is parameter variance and
 ![]() is error variance which is sample variance vector in the
is error variance which is sample variance vector in the ![]() th province. The reliability of the growth parameter estimate is:
th province. The reliability of the growth parameter estimate is:
![]() (21)
(21)
The total reliability index can be obtained by getting the average value of all the provinces. Table 1 indicates that the reliability of the initial state, growth rate and the acceleration estimate of RIS are 0.946, 0.892 and 0.852 respectively, which implies that the data can provide enough information to estimate model. The model (14) can be made using the same explanation.
Table 1. The liner model of RIS and OIS.
Note: With robust standard errors. Intercept included but not reported.
![]()
The consistency estimate between the initial state, growth change and the acceleration is correlativity of ![]() ,
, ![]() and
and ![]() in the individual liner growth model. It can be written as:
in the individual liner growth model. It can be written as:
![]() (22)
(22)
The correlative estimate matrix for the RIS and OIS can be computed as following:
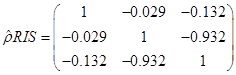
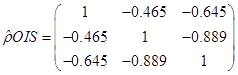 (23)
(23)
It means that the RIS will grow at a faster pace for the province with lower initial RIS as well as the trend of growth and the initial OIS keep same direction. The same trend is presented for the acceleration of RIS. The lower initial value means the higher acceleration and the acceleration of the OIS is contrary.
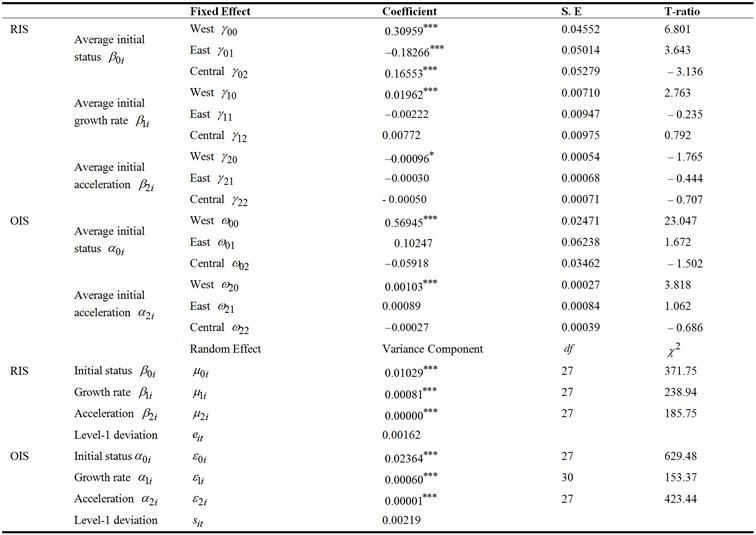
In Table 2 we explore the impact stem from the regional difference on RIS and OIS.
The regional differences have made significant impact on the initial value due to the bigger T-value. In general, the Eastern initial RIS is low 0.18266 units than the western initial RIS on account of ![]() , and the initial RIS in central regions is lower 0.16553 units than in the west regions. This is mainly because Deng Xiaoping’s southern tour speech and the Fourteenth National Congress of the CPC in 1992 indicate the entering of a new stage of the Chinese reform and opening up program. The eastern regions received the international industry transfer firstly rely on the superiority of the opening up program and industrial technology. The increase in housing and car consumption spur the agglomeration of heavy industry in the eastern regions and it becomes the center of the industrial distribution, so the eastern regions have the lowest RIS and the RIS of the mid-west are to be higher. The same explanation can be made for OIS. The east has the highest OIS and the mid-west has the lower OIS. Though some of growth rates are nonsignificant, their effects estimates are rational. The average initial growth rate of RIS in east is about
, and the initial RIS in central regions is lower 0.16553 units than in the west regions. This is mainly because Deng Xiaoping’s southern tour speech and the Fourteenth National Congress of the CPC in 1992 indicate the entering of a new stage of the Chinese reform and opening up program. The eastern regions received the international industry transfer firstly rely on the superiority of the opening up program and industrial technology. The increase in housing and car consumption spur the agglomeration of heavy industry in the eastern regions and it becomes the center of the industrial distribution, so the eastern regions have the lowest RIS and the RIS of the mid-west are to be higher. The same explanation can be made for OIS. The east has the highest OIS and the mid-west has the lower OIS. Though some of growth rates are nonsignificant, their effects estimates are rational. The average initial growth rate of RIS in east is about ![]() units lower than the western and the central growth rate is
units lower than the western and the central growth rate is ![]() units higher than the west in 1995. The average initial growth rates of three regions are positive and their average accelerations are negative, which indicate the gradual slowing growth rate. According to equation (19), the average growth rate in per year can be computed. The OIS initial growth rates of the east-central are respectively
units higher than the west in 1995. The average initial growth rates of three regions are positive and their average accelerations are negative, which indicate the gradual slowing growth rate. According to equation (19), the average growth rate in per year can be computed. The OIS initial growth rates of the east-central are respectively ![]() units higher and
units higher and ![]() units lower than the west. A big reason is that the balanced development of the eastern industrial structure and the propulsion of the market-oriented reform. In addition, the Chinese grand western development program makes the excellent achievement since 2000, nevertheless some western local governments or enterprises place undue emphasis on the increase of the economic aggregate instead of the optimization and adjustment of the industrial structure that is often the most important norm which measures the regional economic development. There are big differences of the growth rates of the RIS and OIS in east, central and west result from the above.
units lower than the west. A big reason is that the balanced development of the eastern industrial structure and the propulsion of the market-oriented reform. In addition, the Chinese grand western development program makes the excellent achievement since 2000, nevertheless some western local governments or enterprises place undue emphasis on the increase of the economic aggregate instead of the optimization and adjustment of the industrial structure that is often the most important norm which measures the regional economic development. There are big differences of the growth rates of the RIS and OIS in east, central and west result from the above.
In table 3 we explore the Change relationship of RIS and OIS caused by science and technology input on three regions and national scale based on the model (17) and (18).
Due to the negative and significant main effects, in the nationwide scope and three regions PE can promote the decline of the RIS, which contributes to the rationalization of the industrial structure. But meanwhile the declines of the OIS lead to the degeneration of the technology level of the industrial structure. So then the optimization of the industrial structure is unattainable. It is mainly because the proportion of the talent of high technical ability is too small in the human capital input of the economic body in the science and technology production. The lack of the high levels talents, the low overall talent level and the imperfect talent system are greatly incompatible with the demand of the industrial structure upgrade. The brain drain and the difficulty in recruitment in all parts of the country are the most typical illustration of the low industrial structure. The positive and significant interaction of DFA and PE for the RIS indicates the combination of the financial agglomeration and human capital input to the RIS. The high DFA often is always with high agglomeration degree of talent, which leads to the non-equilibrium distribution of talent in China and causes the un-rationalization industrial structure.
GI promotes the decrease of the RIS and OIS. This is mainly because that the increase of the government input to science and technology is only for scale and the expansion of the scale does not mean the remarkable effect. The increase of government input will produce the crowing-out effect to other inputs, which cannot achieve directly the goal of the cultivation and the realization of technical innovation. In terms of the Chinese realities, the government invests less to the university (especially for the common college) and small-medium technology enterprises. These departments get little attention from the government and have always been restricted in the middle-end and low-end industrial chain, and it restrains the growth of the OIS. The negative and significant interaction of DFA and GI for the OIS indicates that their combined action make the reverse effect to the OIS. In general the government input lays emphasis on the regions with the high DFA and the DFA significantly affect the proportion of heavy industry. Except the central regions, the DFA make against the optimization of the industrial structure. The main cause is that currently the Chinese heavy industry mostly depends on the capital and labor inputs and does not yet transform to the industry oriented in the technical progress and innovation.
CI promotes the increase of the RIS and OIS basically. Because the corporate pays more attention to the technical industry with the high returns and quick results, the input is non-equilibrium distribution, which hinders the process of rationalization of industrial structure except the eastern region. But else the Chinese corporate input keeps growth tendency relative to the increase of the output of science and technology. With the continued emerge of the technology leading role of the industry corporate, the technological innovation spirit keep growing. The corporate pays more and more attention to the promoting the transformation of the economic development mode relying on science and technology. So the technological input is growing thus promoting the optimization progress of the industrial structure.
Table 2. Output of the liner model of the RIS and OIS’s regional effect.
Note: With robust standard errors. Intercept included but not reported.
![]() .
.
![]() .
.
![]() .
.
Table 3. Output of the liner model of the RIS and OIS caused by science and technology input (Including DFA).
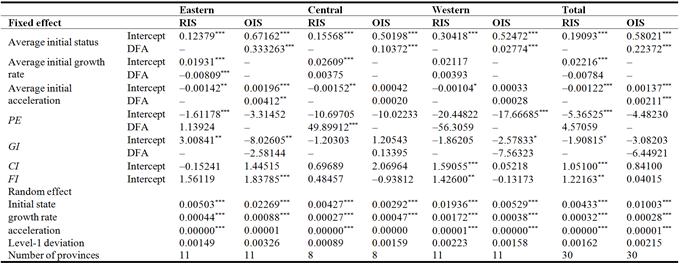
Note: Robust standard errors in parentheses.
![]() .
.
![]() .
.
![]() .
.
FI promotes the increase of the RIS and OIS except the western and the central. The Chinese financial system is imperfect and underdeveloped. The venture fund, angel investment, science and technology insurance, secured financing, the intellectual property mortgage, technology credit, the enterprise IPO and other financial means are far from meeting the needs of the enterprises innovation and the bank loans become the main financing channel. There is a more strict financial surveillance system in the East. It indicates that the bottlenecks contradictions of getting loans for small and medium enterprises which are difficult to meet the financing condition is worsen thereby hindering the rationalization progress of the industrial structure. But it shows that the Chinese banking institutions become increasingly cautious in the screening and selection of the loans. Only the enterprises with the bright prospects, meeting the loan condition and the Industrial structure Adjustment Instruction Table, can obtain the loan more easily. It is helpful to the optimization progress of the industrial structure.
Based on the equation (19), the average growth rates of the RIS and the OIS in nationwide scope are as follows:
the growth rate of the RIS in tth year![]() (24)
(24)
the growth rate of the OIS in tth year![]() (25)
(25)
The regional average growth rate can be computed. The average growth rate of the RIS of Beijing with the highest average DFA is 0.41 percent higher than the national average in 1998 and 1.30 percent lower than the national average in 2005. The average growth rate of the RIS of Guangxi with the lowest average DFA is 2.01 percent higher than the national average in 1998 and 0.30 percent higher than the national average in 2005. The average growth rate of the OIS of Beijing is 2.55 percent higher than the national average in 1998 and is 8.5 percent higher than the national average in 2005. The average growth rate of the OIS of Guangxi is 0.03 percent lower than the national average in 1998 and 0.09 percent lower than the national average in 2005. The cities with the high DFA are most the eastern coastal cities. The abundant financial resources, the effective financial institutions and the perfect financial markets bring on the lower RIS growth rate and the higher OIS growth rate. The relative balance of industrial structure and developed the third industry draws a large number of technical talents and funds, which is ‘peacock files southeast’. In the opposite, some cities with the lower DFA such as some resource-dependent cities and some western provincial capital have the higher RIS growth rate and the lower OIS growth rate due to the lag of reform.
Furthermore, with the continuous deepening of reform and open to the outside world and the promotion of the Chinese grand western development program, the RIS growth rate keeps the decrease trend. It may be because of the increase of the technical input under the guidance of the national industrial policy breed the new products, the new fields and the new industry and the use of the technical input is more scientific and more reasonable, which will cause the translation of the resources to the more productive sector, therefore the industrial structure is in a more rationalization way. However the OIS growth rate of the regions with the low DFA is falling owing to the inefficient financial market and imperfect financial system. The extensive use of capital cannot optimize the allocation of technical inputs in the local industry and the low technical industry crow out the development and expansion of the high-tech industry for its occupation lots of resources. The western tertiary industry is mainly consisted of low-tech enterprises and the medium-sized and small enterprises, which is difficult to finance in the financial market. It leads to the decline of the OIS growth rate in these regions.
It is a remarkable fact that the effects of the financial agglomeration to the RIS growth rates and OIS growth rate reflect in the differences in between provinces from the table 3. The differences exist in the complete sample and regional sample. The explanation could be that the externality of industries, economic foundation, opening-up policy, industrial policy and other factor cause the huge regional difference, and it can be predicted that the regional differences of the RIS growth rate and OIS growth rate will be greater. Table 4 shows the estimate variances of random effects and compare them with variance of the unconditional model (13) and (14). The explained variance proportion is the ratio of the difference between the total variance (Based on the unconditional model) and residual variance (Based on the constructing model) to the total variance. In our data, DFA explains most of the parameter variances of the initial state and the growth rate. In other words, DFA can basically account well for the differences of them.
Table 4. The explained variance by DFA for the initial states and growth rate.
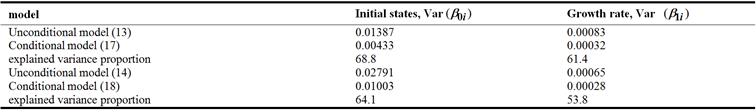
Note: Based on the residual variance from Table 1 and Table 3.
5. Conclusions
In this paper, we develop a model in which the science and technology input play the different roles in the transformation of the mode of Chinese economic development. The model also shows the significant effects of the financial agglomeration to the regional differences of the growth rate of economic development mode. We provide the link between theory and empiric using China data. We define the rationalization of industrial structure (RIS) and the optimization of the industrial structure (OIS) as those exhibiting the inherent nature of the economic development mode and structure the evaluation index system of Chinese finance agglomeration degree. The empirical conclusion shows: Chinese corporate inputs and the financial institutions loans included the technological inputs failed to become the positive factor in the rationalization of industrial structure but promote the optimization of the industrial structure. The human capital input and the government inputs only restrain the optimization of the industrial structure in 1995-2008. There are the huge regional differences about the transformation of the economic development mode. The financial agglomeration is the significant cause leading to the differences and the differences will further increase.
The finding of the paper has an important policy implication: The strategies aim at the positive effects of the technological inputs and the financial agglomeration to the transformation of the economic development mode, and hence, acceleration the reform of the financial system, keeping steady growth of the technological inputs, the productivity transformation of the technology and the development of the independent innovative capacity than those aimed at concentrating the expansion of investment scale project. Therefore, when governments make decisions on technological inputs regarding the transformation of the mode of economic development, it may be desirable that they should take into account the relationship between the regional financial system and the regional economic development mode.
Acknowledgement
This work was supported by The Major Project of National Social Science Fund (![]() ), The Planning Project of Chongqing Social Science Fund (2015QNJJ12) and MOE (Ministry of Education in China) Liberal arts and Social Sciences Foundation (13YJC790149). The author would like to thank China Scholarship Council (CSC), Dr. Zhiting Yang and Wanglong Fu from Southwest University of China for fruitful supports concerning manuscript emendation, and also greatly appreciate the editor and the anonymous referee for their helpful comments and suggestions, which have considerably improved the presentation of this work.
), The Planning Project of Chongqing Social Science Fund (2015QNJJ12) and MOE (Ministry of Education in China) Liberal arts and Social Sciences Foundation (13YJC790149). The author would like to thank China Scholarship Council (CSC), Dr. Zhiting Yang and Wanglong Fu from Southwest University of China for fruitful supports concerning manuscript emendation, and also greatly appreciate the editor and the anonymous referee for their helpful comments and suggestions, which have considerably improved the presentation of this work.
Appendix
Table A1. The evaluation index system of Chinese finance agglomeration degree.
References
Footnotes
*In fact, the coefficients of regional differences related to the, PE, CI, GI, and FI can’t pass the significance test, so the assumption will not affect results.


