Studies on Soil Physical Properties of Salt Affected Soil in Amibara Area, Central Rift Valley of Ethiopia
Ashenafi Worku1, *, Bobe Bedadi2
1Ethiopian Institute of Agricultural Research, Addis Ababa, Ethiopia
2Department of Nature Resource Management and Environmental Science, College of Agriculture and Environmental Science, Haramaya University, Dire Dawa, Ethiopia
Email address

(A. Worku)
*Corresponding author
Citation
Ashenafi Worku, Bobe Bedadi. Studies on Soil Physical Properties of Salt Affected Soil in Amibara Area, Central Rift Valley of Ethiopia. International Journal of Agricultural Sciences and Natural Resources. Vol. 3, No. 2, 2016, pp. 8-17.
Abstract
The objective of this study was to investigate the status of soil physical properties in different salt affected soil classes of Amibara irrigation project areas, central rift valley of Ethiopia. A total 400 soil samples were collected and analyzed for critical salinity and sodicity parameters in both Vertisols and Fluvisols. Based on analytical results, the study area was classified into 6 mapping units: non-saline non-sodic and saline soil in Vertisols; whereas in Fluvisols, non-saline non-sodic, saline, saline-sodic and sodic soils. Triplicate soil samples from 6 mapping units with 2 depths, a total of 36 soil samples were used for determination of soil properties. Standard procedures were employed for the analyses of soil parameters. The results of the study revealed that the soil texture (silt and clay), BD, PD, TP, FC, PWP, AWHC studied were significantly affected (P ≤ 0.05 and/or P ≤ 0.01) by salt affected soil except sand was non-significant in Fluvisols. In Vertisols, clay, BD, PD, TP and PWP non-significantly affected salt affected soil but the rest parameters were significantly affected. The correlation analysis bulk density also affects TP and AWHC. Association of bulk density with ESP and OM was positively and negatively correlated and the reverse is true for both TP and AWHC. Furthermore, BD and TP were significantly (P < 0.05) affected by soil depth in both soil types.
Keywords
Soil Physical Properties, Salinity, Sodicity, Soil Types, Vertisols and Fluvisols
1. Introduction
Salt-affected soils are widely distributed throughout the world, and about 20% of the world’s cultivated land is salt-affected [1]. In Amibara irrigation project area under rift valley system of Ethiopia, highly affected by salt accumulation problem and sizeable areas of this zone are being converted to saline and saline sodic soils annually at an alarming rate [2], [3] and [4]. This problem adversely modified the physical, chemical and biological conditions of the edaphic environment [5]. Alteration of soil physical properties resulting from the swelling and dispersion of soil colloidal particles caused by the presence of excess exchangeable Na, and finally results in water infiltration, air movement, water holding capacity, root penetration and seedling emergence problems [6] [7] and [8]. The bulk density increase with increase sodicity this due to dispersive action of exchangeable sodium on soil colloids results soil compaction and altering the pore size distribution and decrease the total volume of soil [9] and [10].
On other hand under saline soil, soil particles was flocculated because of amount of soluble salts like Ca2+ and Mg2+ ions in soil colloids increased ECe soils and this results for lower bulk density, higher porosity and water holding capacity than sodic soils [11]. [9] reports indicate, particles density decrease with increase salt level values of negative but highly significant correlation coefficients of exchangeable sodium percentage and total dissolved salt times exchangeable sodium percentage with particles density are same (-0.98**) in different soil texture. Available water holding capacity negative correlation has been established between soil ECe and ESP [12]. This has been attributed to the loss of porosity in the AWHC range of saline-sodic due to the processes of swelling and dispersion. Generally, the bulk density, particle density, porosity and water holding capacity are affected by texture, type and amount salts and also by organic matter [9] and [11].
Although information about soil physical properties under salt affected soil classes plays a vital role in enhancing production and productivity of the agricultural products; the soil physical properties under salt affected soil classes of the study area has never been studied. This study was help for planners and farmers to device sound irrigation water and drainage management, soil aeration and others agricultural practices towards sustainability use of soil productivity of the area. Therefore, the objective of this study is to assess the current status soil physical properties on salt affected soil classes of both Vertisols and Fluvisols in the central rift valley of Ethiopia.
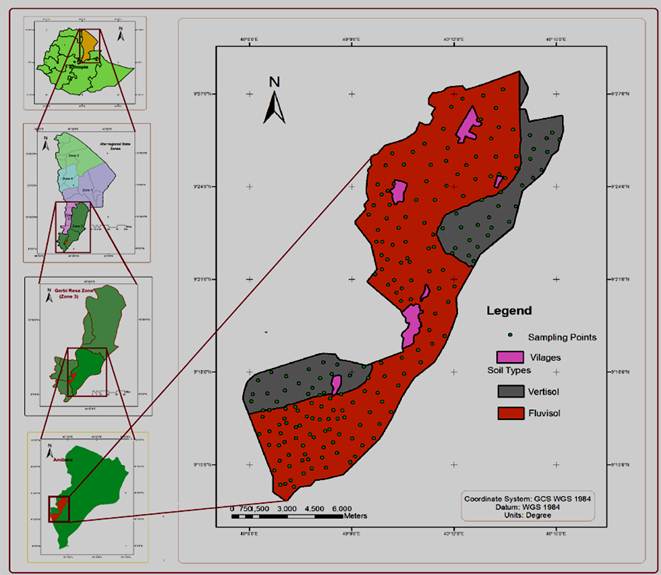
Figure 1. Location map of the study area.
2. Materials and Methods
2.1. Study Area
The study was conducted at Amibara irrigation project area, which is located in Gabiressu zone of Afar National Regional State Ethiopia (Figure 1). The area is at an average elevation of about 740 meters above sea level and is located at 9°12’8" to 9°27’46" N latitude and 40°5’41" to 40°15’21" E longitude in the study area, having a "semi-arid to arid" climatic characteristic. According to the data obtained from the meteorological station of WARC, Amibara irrigation project area is characterized by bimodal rainfall pattern. The mean annual rainfall, maximum and minimum temperature recorded are 571.3 mm, 34.3 and 19.1°C, respectively. The major crop grown is Cotton, with minor crops including Maize, Wheat, Sesame, Banana and Vegetables in some areas of the research center. Currently, the states farmland has been changed to sugarcane plantation. The soil of the study area is predominantly Eutric Fluvents; order Fluvisols followed by Vertisols occupying about 30% of the total area [13] and [14]. There is wide-spread occurrence of salinity and sodicity problem in irrigated area of Amibara irrigation project area [3] and [4].
2.2. Sample Collection, Method of Sampling and Preparation Map Units
Soil sample collection was conducted during the months of September and October 2014. Sample collection was based on the information obtained from Reconnaissance survey and Topographic map (scale 1:50,000) of the study area, two hundred sampling spot areas were identified from topographic map [15]. Accordingly, a total of 400 composite auger samples were collected at a soil depth of 0-20 and 20-40 cm using systematic sampling technique. All 400 soil samples were analyzed for critical salinity and sodicity parameters.
Based on the analysis, the study area was classified into 6 map units: non-saline non-sodic and saline soils in Vertisols; whereas in Fluvisols, non-saline non-sodic, saline, saline-sodic and sodic soils. From each map units, three representative soil sampling areas were selected to take 10-25 soil samples collected from those representative sampling area. Then, with two depths, a total of 36 composited soil samples were used for soil physical properties analysis and other soil fertility status.
2.3. Soil Sample Preparation and Lab. Analysis
2.3.1. Soil Sample Preparation
Soil samples were air-dried, ground to pass through 2 mm sieve and prepared for the determination of selectivity soil physical and chemical properties of fertility indicators.
2.3.2. Analysis of Soil Physical Properties
Soil particle size distribution was determined by the Boycouos hydrometer method [16] and [17]. The soil bulk density, particle density and total porosity (%) were determined according to the methods described by [18]. Soil water holding characteristics i.e. field capacity (FC) and permanent wilting point (PWP) was measured at -1/3 and -15 bars soil water potential, respectively, [19]. The AWHC were obtained by subtracting values of PWP from FC.
2.3.3. Analysis of Soil Chemical Properties
Soil reaction (pHe) and electrical conductivity (ECe) were determined from saturated paste extract following the methods described by [20]. Soil pHe was measured potentiometrically using a digital pH-meter and EC by digital conductivity meter according to the method outlined by the [20] and [21], respectively. Organic carbon was analyzed by wet oxidation with potassium dichromate (K2Cr2O7) in a sulfuric acid medium [22]. Percent organic matter content of the soils was estimated by multiplying the value of percent organic carbon by the conversion factor of 1.724. The exchangeable bases (Ca, Mg Na and K) were determined from extraction of neutral normal ammonium acetate extraction [23]. Ca and Mg were measured by atomic absorption spectrophotometry, while Nawas determined by flame photometer and exchangeable K same method with available K the difference was subtracting water soluble K from the available one. The cation exchange capacity (CEC) of the soils was determined by the neutral normal ammonium acetate method according to the percolation tube procedure [17]. ESP was computed as the percentage of the exchangeable Na to the CEC of the soil.
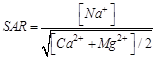
Basic water soluble cations (Ca2+ + Mg2+) were determined by atomic absorption spectrophotometry and Na+ flame photometer, and expressed as mmolc l-1 of extract [24]. SAR value was determined proportion of water soluble sodium to calcium plus magnesium in the soil and is expressed in an equation.
2.4. Statistical Analysis
An analysis of variance was used to test differences in soil micronutrients properties across the different salt affected soil classes and soil depth. For statistically different parameters (P < 0.05), means were separated using the Least Significant Difference (LSD) comparison test. Correlation analyses were also carried out to detect functional relationships among key soil variables. Salt affected soil map was developed by subjecting the GPS readings, salinity and sodicity parameters to the Arc View GIS 10.1 and the degree of salinity and sodicity extent which is expressed as a ECe and ESP value was categorized on the bases of the rating suggested by [21].
3. Results and Discussions
3.1. Salt Affected Soil Classes and Soil Characteristics
The salt affected soil classes characterized form electrical conductivity and sodium absorption ratio of the saturated paste (Figure 2). According to [21] classification, significant parts of Fluvisols were characterized as non-saline non-sodic, saline, sodic and saline sodic soils. Around 27.51% in Fluvisols and 8.76% Vertisols of AIP area are saline soils with ECe greater than 4 dS m-1 and SAR less than 13. About 6.36% in Fluvisols of the area is mapped as saline-sodic soils with ECe and SAR values greater than 4 dS m-1 and 13, respectively. Approximately 0.33% of Fluvisols in AIP area are sodic soils with ECe less than 4 dS m-1 and SAR greater than 13. Among the two types of soils, significant area of farms under the light textured Fluvisols were affected by salinity and sodicity problem; where as in Vertisols, the extent of area affected by salinity was less severe. Moreover, soils with either of sodic or saline-sodic category have not been identified under Vertisols.
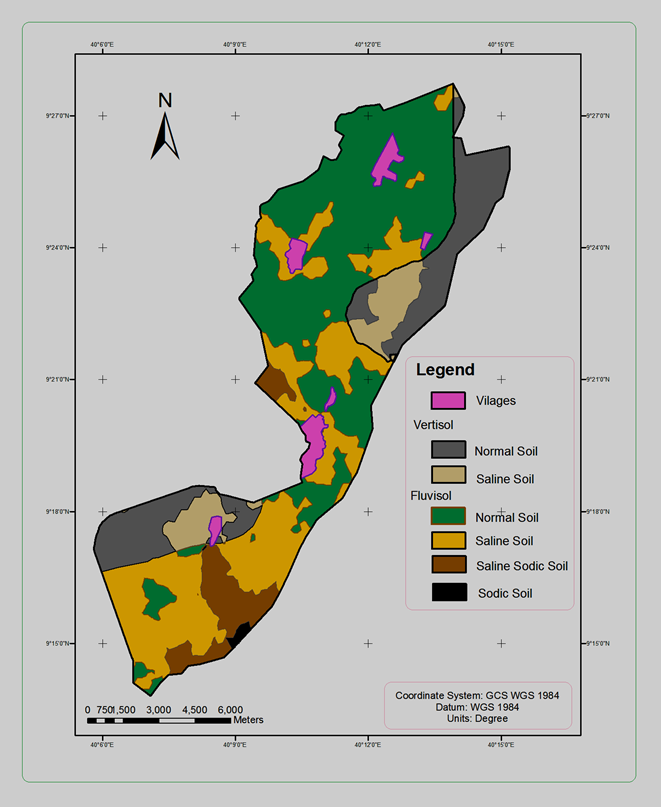
Figure 2. Map of spatial distribution of surface salt affected soils in AIP areas.
The salt affected soil classes of the study area had textural classes ranging from clayey to silt clay loam. The soil reactions were found to range from Neutral to strongly alkaline with a pHe ranging from 7.20 to 8.60 with a mean value of 7.90. The electrical conductivity, organic matter and cation exchange capacity were ranges 0.41-93.94 dS m-1, 0.73-1.75% and 39.24 - 50.12 cmol (+) Kg-1, respectively in the study area. According to the rating of Tekalign (1991), the spatial variability of soil OM contents in the study area was low. The main reason for redaction of organic matter content in the soil was hot climate the study area increase the oxidation of organic residue especially under higher sodium content soil. Exchangeable basic cations in the study area ranged from 21.93 to 39.50 for Ca, 2.18 to 4.21 for Mg, 0.81 to 2.27 for K, and 0.98 to 11.67 cmol (+) kg-1for Na. The soils of study area have higher exchangeable basic cations, the main reason weathering of exchangeable cations rich igneous rocks and insufficient annual rainfall (evapotranspiration exceeding rainfall) to leach the exchangeable basic cation. The result presented in this study area agreed with the results reported by many authors [3] and [4].
3.2. Soil Physical Properties on Salt Affected Soils of AIP Area
3.2.1. Texture
Soil texture have key role in determine water and solute movement within soil profile. The data shows that there were differences in textural classes among the salt affected soil class and soil types (Table 1 and Appendix Table 1). Accordingly, all the salt affected soil classes had textural classes ranging from clayey to silt clay loam in both soil types; with clay accounting for more than 56.73% in Vertisols and 35.92% in Fluvisols of Amibara irrigation project area. Analysis of showed significant variations (p < 0.05) among the mean values of particle size distribution of salt affected soil classes Vertisols and Fluvisols, except clay size of Vertisols was non-significant (p > 0.05). The summation of silt and sand fraction was highest (43.27%) under saline soil and lowest (39.28%) under non-saline non-sodic soil in Vertisols. Contrary to this, the summation of silt and sand fraction was highest (64.08%) under sodic soil and lowest (46.14%) under non-saline non-sodic soil in Fluvisols. The result probably indicate that the formation of salt affected soils was associated with high silt and sand fractions which could be due to larger pore sizes that favours more permeability for solute transport and easy for evaporation. It results for higher accumulation of salt crust in the surface soil. This investigation was supported by those reports [25], [26] and [27].
The particle size distribution did not vary significantly with depth except for silt content in Fluvisols (Figure 3 and Appendix Table 1). Comparison along the soil depth of Fluvisols reveals that the highest and lowest percent of silt contents were observed under the surface layer and subsurface layer, respectively. This could be due to season deposition of silt sediment from upper catchment of the basin with the transported by Awash River and its tributaries. In general, this study indicates, particle size distribution was cause for the formation of salt crust at surface layer result for reduction in soil permeability by clogging of soil pores, decrease in soil porosity and soil hydraulic conductivity [28] and [29].
Table 1. Effects of salt affected soil class some soil physical properties of Vertisols and Fluvisols.
| Salt affected soil classes | Vertisols |
| Clay (%) | Silt (%) | Sand (%) | STC | BD (g cm-3) | PD (g cm-3) | TP (%) |
| NS NSO soil | 60.72 | 30.60b | 8.68a | C | 1.46 | 2.60 | 43.84 |
| Saline soil | 56.73 | 36.85a | 6.42b | C | 1.48 | 2.57 | 42.41 |
| LSD(0.05) | NS | 5.31 | 2.01 | | NS | NS | NS |
| SEM (±) | 2.35 | 1.98 | 0.81 | | 0.030 | 0.019 | 1.20 |
| Fluvisols |
| NS NSO soil | 53.86a | 31.16c | 14.98a | C | 1.34b | 2.57a | 47.85a |
| Saline soil | 41.37b | 47.60b | 11.03a | SiC | 1.42b | 2.56ba | 44.53a |
| Saline sodic soil | 37.78b | 52.26ba | 9.94ba | SiCL | 1.62a | 2.50c | 35.20c |
| Sodic soil | 35.92b | 55.46a | 8.62b | SiCL | 1.54a | 2.51cb | 38.64b |
| LSD(0.05) | 8.91 | 5.46 | 6.35 | | 0.087 | 0.056 | 3.61 |
| SEM (±) | 3.85 | 2.19 | 2.95 | | 0.035 | 0.022 | 1.44 |
*Means within a column and the same factor followed by same letter are not significantly different from each other at P < 0.05. NS = Not significant; LSD = Least significant difference; SEM- Standard error mean; NS NSO= non-saline non- sodic soil; STC = Soil textural class; BD- Bulk Density; PD- Particle Density; TP- total porosity; C-Clay; SiC- Silt Clay; SiCL- Silt Clay Loam
Accordingly, clay content was negatively correlated with Exchangeable sodium (r = -0.63**) and ESP (r = -0.64**), from this correlation, indicates clay texture have smaller Exchangeable sodium and ESP result for less extent of salt affected soil especially sodic soil formation. The reverse is true for silt and sand contents (Table 2).
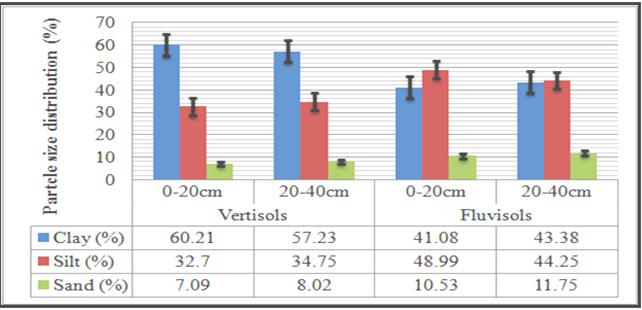
Figure 3. The effect of soil depth on particle size distribution of Vertisols and Fluvisols.
3.2.2. Bulk Density, Particle Density and Total Porosity
Variation in mean values of soil bulk density, particle density and total porosity of different salt affected soil classes were statistically significant (p < 0.05) only for Fluvisols. Moreover, particle density higher values under non-saline non-sodic soil (2.57 g cm-3), whereas lower saline sodic soil (2.50 g cm-3) were recorded in Fluvisols (Table 1 and Appendix Table 1). Similar trend was observed by [9] in salt affected soil of Pakistan. The probably reason indicated by [30] was non-saline non-sodic soil relatively higher concentration of heave metal like iron than that of salt affected soil which the results for reduction in particle density. The reverse is true for calcium and sodium in saline and sodic soil, respectively. Factor may indicate above cause for reduction of particle density on salt affected soil classes. Considering salt affected soil classes effects on bulk density lowest was recorded under non-saline non-sodic soil (1.34 g cm-3) and highest in saline-sodic soil (1.62 g cm-3) in Fluvisols (Table 1). The higher bulk density under saline-sodic and sodic soil could be due to dispersion of floccules’ (granules) by high exchangeable sodium percentage up on wetting and formation of crusts up on drying. In addition to this, lower organic matter was recorded under saline-sodic soil which results for higher bulk density. Correlation analysis showed negatively and strongly significantly associated with organic matter (r = -0.71**) of both soil types (Table 2).
Table 2. Pearson’s correlation matrix between micronutrients and soil properties of the soil samples.
| | Clay | Silt | Sand | BD | TP | AWHC | pHe | ECe | OM | Ca | Na | ESP |
| Clay | 1.00 | | | | | | | | | | | |
| Silt | -0.87** | 1.00 | | | | | | | | | | |
| Sand | -0.46** | 0.03NS | 1.00 | | | | | | | | | |
| BD | -0.24NS | 0.31NS | 0.06NS | 1.00 | | | | | | | | |
| TP | 0.30NS | -0.40* | 0.10NS | -0.97** | 1.00 | | | | | | | |
| AWHC | 0.56** | -0.63** | 0.12NS | -0.59** | 0.51** | 1.00 | | | | | | |
| pHe | -0.24NS | 0.27NS | 0.01NS | 0.01NS | 0.06NS | -0.31NS | 1.00 | | | | | |
| ECe | 0.30NS | 0.32* | 0.02NS | 0.33* | -0.34* | -0.23NS | -0.52** | 1.00 | | | | |
| OM | 0.48** | -0.52** | 0.03NS | -0.71** | 0.64** | 0.54** | 0.19NS | -0.19NS | 1.00 | | | |
| Ca | 0.22NS | -0.35* | 0.17NS | -0.37* | 0.43* | 0.55** | -0.66** | 0.26NS | 0.33* | 1.00 | | |
| Na | -0.63** | 0.64** | 0.14NS | 0.68** | -0.57** | -0.63** | 0.47** | 0.13NS | -0.68** | -0.42* | 1.00 | |
| ESP | -0.64** | 0.66** | 0.08NS | 0.66** | -0.55** | -0.66** | 0.59** | 0.04NS | -0.65** | -0.56** | 0.97** | 1.00 |
BD- Bulk Density; PD- Particle Density; TP- total porosity
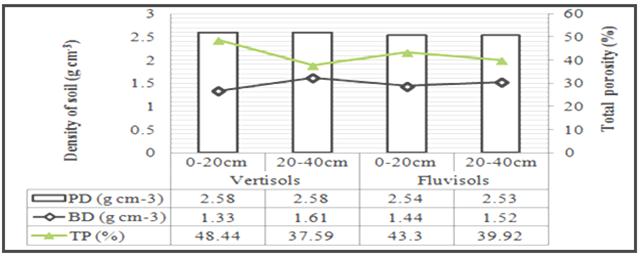
Figure 4. Effect of soil depth on particle density, bulk density and Total porosity of Vertisols and Fluvisols.
Contrary to the case of porosity it was highest in non-saline non-sodic soil (47.85%) and lowest in saline-sodic soil (35.20%) in Fluvisols (Table 1). The same holds true for lower bulk density with concomitant higher porosity in non-saline non-sodic soil could be attributed, among other factors, to relatively lower content of exchangeable sodium and higher organic matter. Factor that affects bulk density also affects total porosity. Association of bulk density with ESP and OM was positively and negatively correlated (r) value of 0.66** and - 0.71**, respectively (Table 2). In general, this results for reduction number large pores and increases number of relatively small sized pores and as a result total porosity decreases implies for increasing bulk density. Similar results were reported by [9], [11], [31] and [32].
Values of bulk density and total porosity between the surface (0 – 20 cm) and sub-surface (20 – 40 cm) soil layer were also significant (p < 0.05) in both soil types (Appendix Table 1). The result shown in soil depth, highest values bulk density and total porosity of 1.61 g cm-3 in sub-surface layer of soil and 48.44% at surface layer of soil were recorded in Vertisols, whereas in Fluvisols, 1.52 g cm-3 in bulk density at sub-surface layer of soil and 43.30% at surface layer of soil (Figure 4). The study area was cultivated for more than 40 years with big machineries, this increase the compaction that implies for increase bulk density at sub-surface soil layer. In general, bulk density and total porosity are normally governed by soil texture, structure, organic matter content and exchangeable sodium percentage. Bulk density value of about 1.33 g cm-3 is generally considered optimum for plant growth [33]. In this finding, higher value of bulk density was obtained that result soil compaction or deterioration of soil structure due to poor organic matter content and higher exchangeable sodium percentage.
3.2.3. Soil-Water Holding Capacity
Mean values of soil water contents at FC, PWP and AWHC varied significantly different (p <0.05) among the salt affected soil classes in both soil types, except PWP which appeared non-significant in Vertisols. In Vertisols, the highest (42.13, 22.37%) and lowest (37.10, 22.05%) soil water contents at FC, and PWP, were recorded for non-saline non-sodic soil and saline soil, respectively (Figure 5 and Appendix Table 1). The same trend was observed for AWHC in Vertisols. In Fluvisols, the highest soil water contents at FC (37.43%) and PWP (24.78%) were seen under the saline soil and sodic soil, respectively, whereas AWHC also highest (18.08%) under non-saline non-sodic soil. The lowest values of FC (35.45%), PWP (19.30%) and AWHC (12.18%) were recorded under saline sodic, non-saline non-sodic and sodic soil respectively (Figure 5).
The observed results generally showed that higher water contents were found under non-saline non-sodic soil in both soil types and the lower being found under sodic soil in Fluvisols. This could be ascribed to the relatively high ESP of soil especially under sodic and saline-sodic soils that might have decreased the soil porosity and the reverse is true for exchangeable Ca and organic matter for facilitation of pore space in non-saline non-sodic and saline soils. Pearson’s correlation matrix shows that, AWHC was significantly and negatively correlated with BD (r = -0.59**) and ESP (r = -0.66**) whereas it was positively associated with organic matter (r = 0.54**) and exchangeable Ca (r = 0.55**) (Table 2). These results agreed with those reported by [11], [34], [35] and [36].
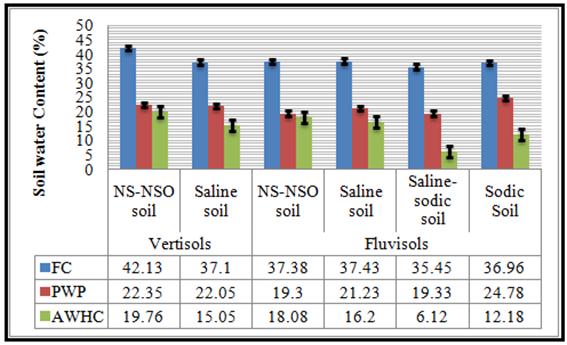
Figure 5. Main effects of salt affected soil class on soil water holding capacity of Vertisols and Fluvisols of AIP area.
*Means within a column and the same factor followed by same letter are not significantly different from each other at P < 0.05. NS = Not significant; LSD = Least significant difference; SEM- Standard error mean; NS NSO = none saline none sodic soil; FC = Field capacity; PWP = Permanent wilting point; AWHC- Available water holding content.
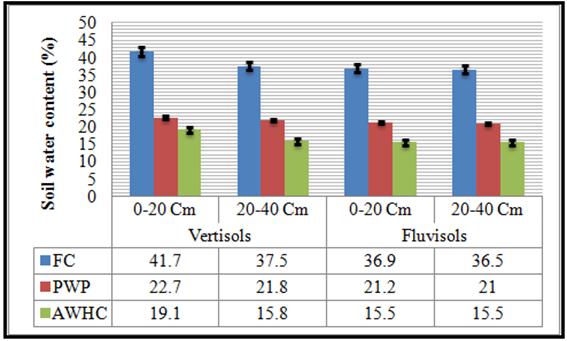
Figure 6. Effect of soil depth on FC, PWP and AWHC of Vertisols and Fluvisols.
The effect of soil depth on soil water contents at FC, PWP and AWHC was not significantly (p > 0.05) varied between surface and subsurface soil in Fluvisols, while in Vertisols, FC and AWHC significantly (p< 0.05) varied between surface and subsurface soil (Appendix Table 1). However, the FC and AWHC were significantly higher in surface (41.70%, 19.05%) soil than sub surface (37.53%, 15.77%) soil in Vertisols, respectively (Figure 6). This could be due to relatively higher accumulation of clay and organic matter on the surface soil than sub surface soil. In addition to this, OM (r = 0.54**) and clay contents (r = 0.56**) were positively correlated with AWHC (Table 2). This could be due to decreases in the quanties of organic materials and clay content with soil depth in all salt affected soils, which might be the reason for decrease available water capacities. The same result was reported by [37] for salt affected soils of Australia.
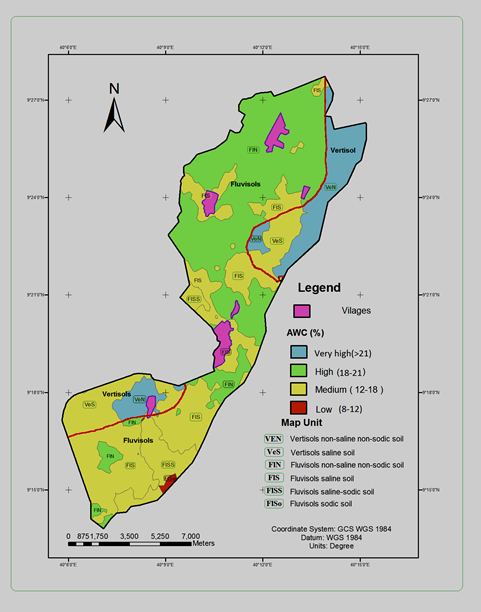
Figure 7. Spatial variability of available water capacity on the surface soils of the study area.
Most of annual crops obtain their water requirement from surface soil of the root zone. According to the rating of [38], spatial variability of available water content on the surface soils (0-20 cm) of study area was rated from low to very high (Figure 7). The lowest AWHC values were recorded in sodic soil of Fluvisols. This has been attributed to the loss of porosity in the AWHC range of sodicity due to the processes of swelling and dispersion effect of exchangeable sodium percentage.
4. Conclusion
The salt affected soil classes characterized form electrical conductivity and sodium absorption ratio of the saturated paste. Area coverages of salt affected soils class were non-saline non-sodic (12.71%) and saline soil (8.76%) in Vertisols; whereas in Fluvisols, non-saline non-sodic (44.33%), saline (27.51%), saline-sodic (6.36%) and sodic soils (0.33%). Soil characteristics of study area, indicated that the soil reaction from slightly alkaline to strongly alkaline (7.53-8.45) and low in organic matter with high soluble salt. The result of study revealed that most of the soil physical properties varied significantly due to the influence of salt affect soil classes in both Vertisols and Fluvisols. Furthermore, the study showed that the texture of the soils in all the salt affect soil classes was clayey in Vertisols, whereas in Fluvisols, it ranged from clay to silt clay loam. The bulk densities of the soils ranged from 1.46 to 1.48 g cm-3 in the Vertisols and from 1.34 to 1.62 g cm-3 in the Fluvisols. Hence, in terms of soil fertility, the bulk densities indicated that the soils were too compact and difficult to plant roots penetration especial under sodic and saline sodic soils. The highest soil water contents at FC, PWP and AWHC were observed in non-saline non-sodic soil of the Vertisols and Fluvisols, except for the PWP which was recorded on sodic soil in Fluvisols. The highest water contents were recorded at non-saline non-sodic soil could be related the higher OM and lower ESP contents in these lands compared to the saline sodic and sodic soil.
Appendix
Table A1. Mean square (MS) and results of two-way analysis of variance of soil physical properties under salt affected soil Class and two soil depths in the AIP areas.
| Soil parameters | Mean squares for source of variation‡ |
| SAS (3) | Soil depth (1) | SAS * depth (4) | Error (14) | CV (%) |
| Fluvisols |
| Sand | 55.70* | 20.38NS | 1.93NS | 3.60 | 25.44 |
| Silt | 1973.56** | 106.68* | 7.07NS | 3.10 | 11.66 |
| Clay | 1194.10** | 154.02NS | 15.85NS | 5.06 | 20.57 |
| BD | 0.091** | 0.035* | 0.01NS | 0.03 | 5.79 |
| PD | 0.009* | 0.001NS | 0.00NS | 0.05 | 2.20 |
| Porosity | 196.49** | 41.01* | 13.98NS | 2.04 | 8.56 |
| FC | 5.19* | 0.29NS | 0.69NS | 0.76 | 3.58 |
| PWP | 39.87** | 0.00NS | 1.48NS | 1.18 | 9.70 |
| AWHC | 37.14** | 0.32NS | 0.17NS | 0.58 | 6.52 |
| Vertisols |
| SAS (1) | Soil depth (1) | SAS * depth (1) | Error (6) | CV (%) |
| Sand | 15.23* | 2.53NS | 0.06NS | 1.14 | 26.36 |
| Silt | 117.18* | 12.61NS | 22.68NS | 2.18 | 14.44 |
| Clay | 47.92NS | 26.46NS | 25.17NS | 3.32 | 9.82 |
| BD | 0.00NS | 0.23* | 0.01NS | 0.03 | 1.89 |
| PD | 0.00NS | 0.00NS | 0.00NS | 0.04 | 5.00 |
| Porosity | 4.78NS | 362.67** | 18.62NS | 1.70 | 6.87 |
| FC | 76.00* | 52.08* | 19.76NS | 1.65 | 7.25 |
| PWP | 0.30NS | 2.34NS | 22.14NS | 1.15 | 8.98 |
| AWHC | 66.74** | 32.34** | 0.06NS | 0.84 | 8.42 |
| | | | | | |
‡Figures in parenthesis = Degrees of freedom; * = Significant at P < 0.05; ** = Significant at P < 0.01; NS = Not significant at P > 0.05; CV = Coefficient of variation; BD = Bulk density; PD = Particle density; FC = Field capacity; PWP = Permanent wilting point; AWHC=Available water holding capacity
References
- Schumann A. W. and Sumner M. E. 2000. Chemical evaluation of nutrient supply from fly ash-biosolids mixtures. Soil Science Society of America Journal Iss 164: 419-426.
- Heluf Gebrekidan. 1985. Investigation on Salt-affected Soils and Irrigation Water Quality in Melka Sadi-Amibara Plain, Rift Valley Zone of Ethiopia. MSc. Thesis, Addis Ababa University, Addis Ababa, Ethiopia.
- Gedion Tsegaye. 2009. Surface water-Groundwater Interactions and Effects of Irrigation on Water and Soil Resources in the Awash Valley. MSc Thesis, Addis Ababa University. Addis Ababa, Ethiopia.
- Frew Abebe. 2012. Appraisal and mapping of soil salinity problems in Amibara area of middle awash basin MSc Thesis, School of Graduate Studies, Haramaya University. Haramaya, Ethiopia.
- Worku A, Minaleshewa M. and kidan H. G. 2016. Impact of Gypsum and Sulfuric Acid Application on Cotton Yield under Saline Sodic Soil Condition in Melka Sadi Irrigated Farm. Acad. J. Agric. Res. 4(2): 091-095.
- Pearson K. E. 2004. The basic effects of salinity and sodicity effects on soil physical properties. http://waterqualityMontana.edu/docs/methane/basics_highlight.shtml
- Ghafoor, A., Murtaza, G., Ahmad, B. and Boers, T. H. M. 2008. Evaluation of amelioration treatments and economic aspects of using saline-sodic water for rice and wheat production on salt-affected soils under arid land conditions. Journal of soil and Irrigation Drainage, 57: 424-434.
- Murtaza, G., Ghafoor, A., Owens, G., Qadir, M. and Kahlon, U.Z. 2009. Environmental and economic benefits of saline-sodic soil reclamation using low quality water and soil amendments in conjunction with a rice-wheat cropping system. Journal of Agronomy Crop Science, 195: 124–136.
- Muhammad Siddique Shakir, Anwar Hassan and Abdul Razzaq. 2002. Effect of salt on bulk density, particle density and porosity of different soil series, Asia Journal of plant sciences, 5(1): 5-6.
- Barik, K. M., Canbolat, Y., Yanık, R. and Rafiq K. 2011. Compressive behavior of soil as affected by aggregate size with Different textures in turkey. Journal of Animal and Plant Sciences, 21(2): 186-192.
- Srivastava, P. K., Gupta, M., Pandey, A., Pandey, V., Singh, N., and Tewari, S. K. 2014. Effects of sodicity induced changes in soil physical properties on paddy root growth. Journal of Plant Soil Environmental, 60(4): 165–169.
- Dang, Y. P., Dalal, R. C., Routley, R., Schwenke, G. D. and Daniells, I. 2006. Subsoil constraints to grain production in the cropping soils of the North-Eastern Region of Australia. Australian Journal of Experimental Agriculture, 46 (1): 19–35.
- Italconsult. 1969. Melka Sadi Amibara proposed Irrigation Project feasibility study. Middle Awash, Ethiopia.
- Halcrow, W. and Partners, T. 1982. Drainage and Salinity recommendations for field drainage. WARDA.
- Halcrow, W. and Pattern T. 1989. Master Plan for the Development of Surface Water Resources in the Awash Basin. Final Reports, Ethiopian Valley Development Studies Authority.
- Bouyoucos, G. J. 1962. Hydrometer method improved for making particle size analysis of soil. Agronomy Journal, 54: 464-465.
- Van Reewijk, L. P. 1992. Procedures for soil analysis (3rd Ed.). International Soil Reference Center, Wageningen, Netherlands.
- Black C. A. (1965): Method of Soil Analysis. Part 2. Chemical and Microbiological Properties. American Society of Agronomy, Inc, Madison.
- Klute, A. and Dirksen, C. 1965. Water holding capacity. pp 273-278. In: C.A. Black (ed.).Methods of soil analysis. Agronomy part I, No. 9. American society of agronomy. Madison, WI, USA.
- FAO (Food and Agriculture Organization). 1999. Soil Salinity Assessment: Methods and Interpretation of Electrical Conductivity Measurements. FAO Irrigation and Drainage Paper 57, Rome, Italy.
- USSLS (United Stated Soil Laboratory Staff). 1954. Diagnosis and improvement of saline and alkali soils. USDA Agriculture Handbook 60, USDA, Washington, D. C.
- Walkley, A. and Black, I. A. 1934. An examination of the Digestion method for determining soil organic matter and a proposed modification of the chromic acid titration method. Journal Soil Science. 37: 29-38.
- Gupta, P. K., 2000. Soil, Plant, Water and Fertilizer Analysis. AGROBIOS Publisher, India.
- Melese Menaleshoa and Gemechu Sorsa. 2010. Manual for Soil, Plant and Water Analytical Methods. Jije Analytical Survice Laboratory, Addis Ababa, Ethiopia.
- Rogobete, G., Tarau, D. and Grozav, A. 2011. Solute transport swelling and shrinking in salt affected soils. Journal of Agricultural Sciences, 7(2): 34-38.
- Rogobete G., Tarau D., Dicu D. and Bertici R. 2013. Capillarity and solute transport in swelling and shrinking soils. Soil Forming Factors and Processes from the Temperate Zone 12(2): 53-59.
- Siyal, A. A., Van Genuchten, M. Th. and Skaggs T. H. 2013. Solute transport in a loamy soil under subsurface porous clay pipe irrigation, Journal of Agricultural Water Management, 121(6): 73-80.
- Shainberg, I. and Levy, G. J. 1992. Physical-chemical effects of salts upon infiltration and water movement in soils. In: Wagenet R.J. (eds.):Interacting Processes in Soil Science. Advances in Soil Sciences. Lewis Publishers, Boca Raton.
- Ame’zketa, E. 1999. Soil aggregate stability: a review. Journal of Sustainable Agriculture, 14: 83–151.
- Worku A. 2015. Assessment and Mapping of Fertility Status of Salt Affected Soils Amibara Area, Central Rift Valley of Ethiopia MSc Thesis, School of Graduate Studies, Haramaya University. Haramaya, Ethiopia.
- Akhter, J., Murray, R., Mahmood, K., Malik, K. A. and Ahmed, S. 2004. Improvement of degraded physical properties of a saline-sodic soil by reclamation with kallar grass (Leptochloa fusca). Journal of Plant and Soil, 258: 207–216.
- Singh A. P. and Singh A. R. 2013. Seasonal Changes In Physico-Chemical Attributes Of Salt Affected Habitat, Indian Journal of Science Research, 4(1): 105-115.
- USDA (United Stated Department of Agricultural) Natural resource Conservation Service. 2008. Soil Quality indicators, Adapted from The Nature and Properties of soil, 10th Edition, Nyle C. Brady, Macmiillan Publishing Company.
- El Amin, E. A. A., Hussein, A. A. and El Mahi, Y. E. 2000. Influence of induced salinity and sodicity on manganese sorption in Vertisols and Aridisols. Soil Science and Plant Analysis Communication, 31(2): 455-463.
- Flowers, T. J. and Flowers, S. A. 2005. Why does salinity pose such a difficult problem for plant breeders? Journal of Agriculture Water Management, 78:15-24.
- Kirkham, M. B. 2005. Principles of soil and plant water relations. Elsevier Academic Press San Diego, California.
- Nguyen Duy Nang. 2012. Plant Availability of water in soils being reclaimed from the saline-sodic state. PhD dissertation, Adelaide University, Adelaide, Australia.
- Beernaert, F. 1990. Simple and practical methods to evaluate analytical data of soil profiles. Maputo, Mozambique.


