Spatial and Temporal Distribution of Solar Irradiation in Río de la Plata Coast and Its Relationship with Climate Variables of Interest for Viticultural Production
Gerardo Echeverría1, Milka Ferrer1, Rodrigo Alonso-Suárez2, José M. Mirás-Avalos3
1Department of Plant Production, Faculty of Agronomy, UDELAR, Montevideo, Uruguay
2Solar Energy Laboratory, CENUR Litoral Norte, UDELAR, Salto, Uruguay
3Centro de Edafología y Biología Aplicada del Segura (CEBAS-CSIC), Murcia, Spain
Email address

(G. Echeverría)
Citation
Gerardo Echeverría, Milka Ferrer, Rodrigo Alonso-Suárez, José M. Mirás-Avalos. Spatial and Temporal Distribution of Solar Irradiation in Río de la Plata Coast and Its Relationship with Climate Variables of Interest for Viticultural Production. International Journal of Agricultural Sciences and Natural Resources. Vol. 3, No. 4, 2016, pp. 22-33.
Abstract
The current article investigates the relationships between solar irradiation and other climate variables of interest for viticulture; as well as with climate indexes used worldwide for viticultural zoning. Global solar irradiation was estimated through satellite imagery and, from this, photosynthetically active radiation (PAR) was calculated using a diffuse fraction model. Data were examined for six viticultural regions distributed along the Río de la Plata coastline, in South Uruguay for vintages 2011 to 2014. Results showed that available solar energy decreases from west to east in the coastline. Interannual variability is greater than spatial variability. Significant correlations were found between solar irradiation and reference evapotranspiration (R2=0.80), sunshine duration (R2=0.71), maximum (R2=0.48) and mean temperature (R2 =0.39). A negative relationship was found for relative humidity (R2= 0.40). Energy accumulation over the growing period showed a similar behaviour to the Adapted Heliothermal Index (R2=0.98), whereas mean daily irradiation for February was negatively correlated with the adapted Dryness Index (R2= 0.53). At the vineyard scale, a relationship between PAR and global solar irradiation of 48.3% was determined. Due to the limitation to the use of solar energy imposed by high temperatures, the amount of energy used by the vineyard represented a 34.3% of the global solar irradiation. Satellite images allowed for an accurate estimation of solar irradiation in locations where no ground observations are available. Moreover, this information can be used for viticultural zoning and for determining interannual variation of environmental conditions and for analyzing their influence on plant development and vintage quality.
Keywords
Solar Irradiation, Satellite Images, PAR Estimation, Multicriteria Climate Classification System, Río de la Plata, Viticulture
1. Introduction
In all viticultural regions, the effect of climate conditions on wine quality is widely recognized. Climate conditions vary in time and space. The effect of the annual climate variations is known as "vintage effect" [1]. In fact, wine sensory profile has been reported to be influenced by its origin, the climatology of vintage and wine-making techniques [2].
The effect of vintage on berry size and composition is very important and reported on a great number of works dealing with the impact of climatic conditions on the synthesis of berry quality components [3][4][5]. In addition, the effects of climate, soil, and cultivar have been found highly significant with regard to vine behaviour and berry composition. It is likely that the effects of climate and soil on fruit quality are mediated through their influence on vine water status [6]. In the production conditions of Uruguay, vintage effect is greater than that of cultivar or management practices [5].
Wine production in Uruguay occurs along the coastline of Río de la Plata, in a region 40 km wide and 300 km long, approximately. The five departments from the coastline held 93.8% of the vineyard surface in the country, with 97% of the national production [7]. This region presents particular climate conditions due to the ocean influence and its study might provide further insights on vine response, well as for proposing strategies for mitigating climate change effects. The Sea-Land Breeze, with great influence in the region studied, is a mesoscale response of the atmosphere to horizontal variations in surface heating that is associated with the temperature difference between land and sea [8], caused by solar irradiation.
In order to describe the climate conditions in which viticulture is developed worldwide, a Multicriteria Climate Classification System has been proposed [9]. This methodology is widely accepted for discriminating production regions on a climate basis. With the aim of establishing objective criteria for viticulture zoning in Uruguay, Ferrer et al [10] adapted the indices used in the aforementioned system by modifying the analysis period and taking the potentially available water of the soil from its actual capacity for assessing soil water balance instead of using a standard value.
Solar irradiation on the surface is of paramount importance for many applications, such as calculating the radiative budget of the earth surface for climate studies, agrometeorology, hydrology, surface temperature interpretation and evaluation of crop yields [11].
The importance of solar energy on agricultural production transcends its indirect effect on climate, determines the maximum potential for crop production, along with factors such as CO2, genotype and temperature [12]. Nevertheless, most of the studies about agricultural systems tend to analyze the effects of light and temperature separately [13], as if they were independent variables.
According to Ponzoni and Skimabukuro [14] and Goudriaan and Van Laar [15], the proportion of PAR on the incident global radiation varies from 45% under sunny conditions (diffuse fraction is 0.2) to 55% under overcast conditions (diffuse fraction is 1). Other relationships mentioned by several authors are between 42.2% and 52% [16] [17] [18].
The effects of solar energy (light or heat) on grapevine have been previously studied. Irradiation influences on the reference evapotranspiration (ETo) [19] whereas PAR availability increases dry matter production [20]. Solar irradiation exerts a dominant effect on vine physiology through photosynthesis, thermal and phytochrome responses [13] thus affecting synthesis and degradation of chemical components in the berries. Increases in irradiation are associated to higher contents in soluble solids in the berries and lower malic acid concentrations [21]. Some authors reported a positive correlation between irradiation and anthocyanins synthesis [22], whereas others indicated that anthocyanin contents in the berries are the result of a combined effect between solar irradiation and berry temperature, synergistic at moderate temperatures but potentially antagonistic at high temperatures [23]. Environmental factors such as solar irradiation, air temperature and water shortage parameters will interfere with the ratio acid/sugar, the aroma, color intensity and yield [24].
Direct measurements of solar irradiance can be obtained from pyranometers. The network of these instruments is not always sufficiently dense and measurements are not always reliable, in particular, their inter-calibration [11]. This is one of the main reasons why viticulture zoning based on solar irradiation is uncommon. However, from an image taken by a geostationary satellite it is possible to estimate solar irradiation on the earth surface with low uncertainty. These satellites are able to scan large portions of land, thus generating information with a temporal frequency of several images per hour, although with a moderate spatial resolution (1 km).
Open access satellite images allowed for multiplying the studies about hourly solar irradiation. In Bordeaux, the spatial and temporal variability of solar irradiation has been studied between 2001 and 2005 using information from Meteosat satellite. This showed a decreasing trend on solar irradiation from west to east [25]. Mean values obtained for August and September were used for dividing this viticulture region into three zones with low, medium and high solar irradiation. Terrain slopes and their orientation induced considerable variations on irradiation within the oriental part of the region. Vegetative development and maturation potential of the different zones within the Bordeaux Designations of Origin were discussed on the basis of the obtained zoning.
Other works based on the spatial distribution of the solar irradiation allowed for characterizing the regions of Valtellina, Lombardy [26] and Tokaj [27], correlating solar energy to the amount and quality of the harvest. These results highlight the need for mapping solar irradiation with high resolution, which would enhance the scientific knowledge about its impact on vineyard water balance, grapevine growth development and berry maturation.
Abal et al [28] presented the "Solar Map of Uruguay", with conclusions about the spatial and temporal distribution of annual and monthly irradiation over the whole country. Mean global irradiation values vary between 2,1 ± 0,4 kWh/m2 in June and 6,7 ± 0,9 kWh/m2 in January, with an annual average of 4,4 ± 0,7 kWh/m2. Spatial distribution of irradiation over the Uruguayan coast of Río de la Plata during the summer months shows a decreasing trend from west to east. This first map was made using the few irradiation records available in the country prior to 2010 and sunshine hours daily records acquired by the National Wather Service (INUMET, Uruguay). It was based only on ground measurements, which provides limited spatial and temporal resolutions. Both aspects can be greatly improved using satellite images. In Alonso-Suárez et al [29] a satellite-based model for hourly irradiation estimates was developed for Uruguay. This new information provided hourly records from 2000 to date with a 1 km spatial resolution and reduced uncertainty. For monthly values, the uncertainty of satellite model is ~4% and for long-term values is ~2% [30]. Estimates from this model have been used to develop the second version of Uruguay's first Typical Meteorological Year Meteorological Year for Solar Energy Applications [31].
The magnitude of solar irradiation provides information about the amount of light and heat that a plant can receive in a given period and location; therefore, it constitutes a first-rate variable for viticulture zoning, providing key elements for understanding phenological development, biomass production potential and berry composition [32].
In the current study, the spatial and temporal distribution of solar irradiation over viticulture areas on the left coast of the Río de la Plata are analyzed. The correlation between solar irradiation with temperature, ETo, relative humidity, sunshine duration and the indexes provided from the Multicriteria Climate Classification System were assessed. Finally, the amount of PAR at the vineyard scale was estimated and related to canopy temperature. As a practical application, reference parameters for characterizing the interannual variation were generated by determining solar irradiation intervals.
2. Materials and Methods
2.1. Estimation of Solar Irradiation, Temperature, Reference Evapotranspiration, Relative Humidity and Sunshine Duration
Solar irradiation was estimated using a satellite statistical model developed by the Solar Energy Laboratory (LES) of UDELAR [29]. This model uses images from GOES-East satellite that are generated for South America each half hour, with a nominal spatial resolution of 1 km. The model is called BD-JPT and allows for calculating hourly global irradiation on the soil surface. It is a modification of the previous JPT model [33], by introducing a dependence on brightness on their parameters, which improved considerably its performance. Those parameters were adjusted to the Uruguayan territory by using measurements of controlled quality acquired by the measurement network of LES/UDELAR. This network uses first class or secondary standard pyranometers, according to the World Meteorological Organization [34]. These pyranometers are calibrated every two years against a secondary standard which is kept traceable to the primary standard in the World Radiation Center. The uncertainty of the model, assessed by comparison with measurements independent of those used for adjusting it, was 14% and 7% at the hourly and daily scale, respectively [29]. Both percentages are expressed with respect to the average of the estimated at each temporal scale. At the hourly scale, the uncertainty of the estimation from satellite is lower than that from interpolating ground data [35], except for when measurement sites are very close to the spot to be estimated (~35 km for satellite models at ~20%). At the daily scale, the uncertainty of the satellite model is similar to that from a first-class instrument located on the ground (7%).
Monthly and daily values were estimated for the period 01/2010 to 03/2014 and monthly averages for the period 01/2000 to 03/2014. For the study case, hourly irradiation was daily estimated from 05.01.2011 to 11.01.2011. Irradiation is expressed in MJ/m², both for monthly and daily values. Estimated irradiation values include the whole solar spectrum, from 310 nm to 2800 nm, and include ultraviolet (UV), visible (V) and near infrared (NIR) wavelengths.
Locations of sampling sites and plots distributed over 300 km along the coast of Río de la Plata are presented in table 1 and figure 1.
Table 1. Location of sampling sites and reference weather stations used in the current study.
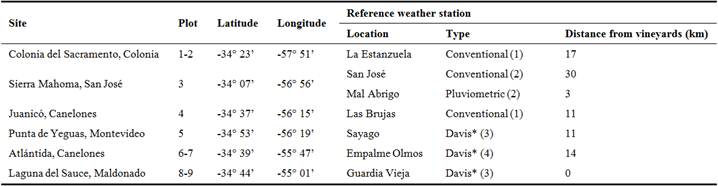
Operators: (1) InstitutoNacional de InvestigaciónAgropecuaria (INIA), (2) InstitutoUruguayo de Meteorología (INUMET ex DNM), (3) Facultad de Agronomía UDELAR, (4) Private. * Automatic station "Vantage Pro2"
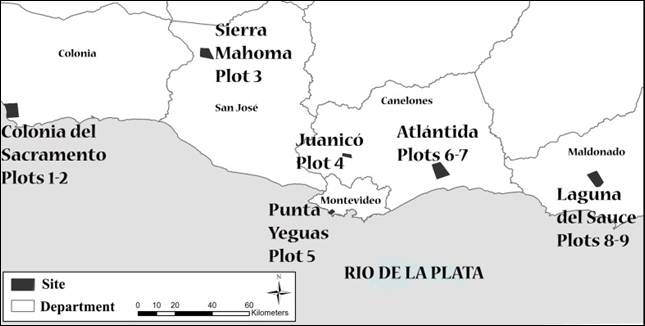
Figure 1. Location of the study sites (grey) and plots along the Uruguayan coast of Río de la Plata.
From the generated information, the irradiation received in each of the study sites during the period September to March and January to harvest was calculated. Topography was not considered for this estimation because solar height angle does not change significantly. In all the studied plots, terrain aspect is lower than 6° (10.5% slope) and mostly lower than 3° (5.2% slope).
Climate variables during 2011, 2012, 2013 and 2014 were obtained from different weather stations managed by several institutions (Table 1). They were all installed and operated under the technical standards of the WMO and were distributed over the coast. Data from 3 conventional stations, 3 automatic stations ("Vantage Pro2", Davis Instruments, Hayward, CA, USA; hereof "Davis") were used and also data from one pluviometric station in order to reduce possible errors from a reference station located at 30 km from the vineyard.
Data series were subjected to validation tests according to the norm UNE 500540 (2004). Those series that did not fulfill basic standards were removed and those which presented "suspicious" data after the first filters were validated or removed after visual inspection.
2.2. Correlations Between Solar Irradiation and Temperature ETo, Relative Humidity, Sunshine Duration and Multicriteria Climate Classification Indices
The correlation among the values of daily irradiation at Colonia del Sacramento (plots 1 and 2) and Juanicó (plot 4) with climate variables from the same areas was analyzed between 01/01/2010 and 31/03/2014. Climate data was provided by reference weather stations.
The viticulture climate indexes for the study sites were calculated for the years 2011, 2012, 2013 and 2014, according to the Multicriteria Climatic Classification System (MCC) method for grape-growing regions defined by Tonietto and Carbonneau [9], adapted by Ferrer et al [7] using specific conditions for Uruguay. Three synthetic and complementary viticultural climatic indexes were computed: Heliothermal Index (HIA), Dryness Index (ISA) and Cool Night Index (CIA).
The Heliothermal index (HIA) was adapted to the crop cycle (1st September to 28th February) for Uruguay by Ferrer [7]. The following equation was used:
HIA =∑ [(Tavg.-10°C) + (Tmax.-10°C)]/2
Where: Tavg is mean daily temperature and Tmax is maximum daily temperature.
The Dryness index (ISA) corresponds to the potential water balance of the soil in Riou´s index, and has been adapted by Ferrer [7] for the specific crop conditions of Uruguay by taking into account the readily available water (RAW) of the soil in the studied plots (47.6 to 105.5 mm) and the crop cycle (1st September to 28th February), values were calculated monthly. This index summarizes the presence or-absence of dryness.
W = Wo + P − Tv – Es,
Where W is the estimated soil water reserve at the end of a given period. Wo is the soil water–holding capacity, P the precipitation and Tv the potential transpiration in the vineyard. Es is the direct evaporation of water from the soil.
The Cool night Index (CIA) is an indicator of night temperature conditions during maturation. In our case, February values were considered
2.3. Case Study at the Vineyard Level
The case study was performed over the period from 05.01.2011 to 11.01.2011, in plot 6, located in Atlántida (Figure 1). The cultivar was Tannat, in a vertical shoot positioning, north-south oriented, the lowest wire was at 0.9 m and the highest wire was at 1.7 m. Canopy temperature was registered using dataloggers (HOBO Pendant® Temperature/Light 64K) installed in the cluster zone.
Proportion of PAR from the hourly global irradiation was estimated from the global irradiation obtained by satellite imagery. For doing this, atmospheric transmissivity (τa) was calculated in order to estimate the diffuse fraction (fd) and, from that information, the percentage of PAR for each hour. The following equation was used for calculating τa:
τa = GHI*So-1*Senβ-1,
where GHI is the global solar irradiation at the surface on an hourly scale, So is the hourly value of the solar constant corrected due to Earth-Sun distance and Senβ is the sinus of the solar height angle (incidence angle of solar beams over the surface). From τa, fd was estimated using the model reported by Ruiz-Arias et al. [36] using coefficients adjusted to Uruguay by Abal et al. (2016) through the expression:
fd=0,974 - 1,014*EXP(-EXP(3,069 - 6,168* τa)).
The proportion of PAR for each hour was calculated from the diffuse fraction values according to Goudriaan and Van Laar (1994) [15]. A minimum of 45% PAR (with respect to GHI) for a diffuse fraction of 0.1 and a maximum of 55% PAR for a diffuse fraction of 1. For intermediate values, we used a regression line defined between those two thresholds. Thus, PAR is calculated hourly and can be accumulated over the day. Finally, the proportion of available PAR was calculated, namely, hourly PAR at the same time that canopy temperature was lower than 35°C.
2.4. Statistical Analysis
Linear and non-linear regression were used for evaluating the relationships between solar irradiation and other climate variables and indices.
Analysis of variance (ANOVA) was used for assessing the influence of year and site on solar irradiation. Means were separated using the Tukey test (p = 0.05).
All analyses were performed using InfoStat software version 2011 (GrupoInfoStat, FCA, Universidad Nacional de Córdoba, Argentina. URL http://www.infostat.com.ar)."
3. Results
3.1. Correlation Between Solar Irradiation and Temperature, ETo, Relative Humidity and Sunshine Duration
Strong correlations (Table 2) between solar irradiation and ETo (R2=0.80) and sunshine duration (R2=0.71) were verified. For temperatures, the highest correlation was observed with maximum daily temperature (R2=0.48), whereas minimum daily temperature showed a low regression coefficient (R2=0.18). Finally, relative humidity was fairly correlated to solar irradiation, although negatively (R2= - 0.40).
The slopes of the regression lines were higher for maximum temperature and relative humidity, hence slight relative increasings in solar irradiation might cause important modifications on these climate variables (Table 2).
Table 2. Regression lines between daily solar irradiation (x= MJ*m-2*day-1) and climate variables (Y). Sites: Colonia del Sacramento (plots 1 and 2) and Juanicó (plot 4). Period from 01/01/2010 to 31/03/2014.
| Regression of daily solar irradiation with: | Regression line | R2 | N | p-value |
| Daily mean temperature (°C) | Y= 9.98 + 0.40x | 0.39 | 3102 | <0.0001 |
| Daily maximum temperature (°C) | Y= 13.73 + 0.51x | 0.48 | 3102 | <0.0001 |
| Daily minimum temperature (°C) | Y= 7.23 + 0.27x | 0.18 | 3102 | <0.0001 |
| Reference evapotranspiration (mm) | Y= -0.28 + 0.21x | 0.80 | 3102 | <0.0001 |
| Relative humidity (%) | Y= 86.91 - 0.82x | 0.40 | 3102 | <0.0001 |
| Sunshine duration (hours) | Y= 0.86 + 0.39x | 0.71 | 3102 | <0.0001 |
3.2. Spatial and Interannual Variability of Solar Irradiation
Monthly distribution of solar irradiation averaged for all the study sites (Table 3) provides a general overview about the evolution of irradiation conditions on the coast of Río de la Plata over the growing cycle.
Table 3. Summary statistics for daily values of monthly irradiation (values correspond to the average of the daily solar irradiation from every site during the years 2011, 2012, 2013 and 2014).
| Month | Units | September | October | November | December | January | February | March |
| Mean | MJ*m-2*day-1 | 14.52 | 18.69 | 24.40 | 27.42 | 26.53 | 21.28 | 18.78 |
| Minimum | MJ*m-2*day-1 | 14.02 | 17.77 | 23.55 | 26.82 | 25.54 | 20.24 | 18.51 |
| Maximum | MJ*m-2*day-1 | 15.02 | 19.61 | 25.25 | 28.02 | 27.52 | 22.32 | 19.05 |
| Standard deviation | | 1.26 | 2.29 | 2.13 | 1.50 | 2.47 | 2.61 | 0.67 |
| Coefficient of variation | % | 8.67 | 12.26 | 8.72 | 5.48 | 9.32 | 12.24 | 3.54 |
Higher irradiation values were recorded in December (27.42 MJ*m-²*day-1) and January (26.53 MJ*m-²*day-1). The highest coefficients of variation (CV) were found in October (12.26%) and February (12.24%), whereas the most stable months were March (3.54%) and December (5.48%).
Mean daily irradiation values for each site indicated a geographical trend with decreasing values along the coast from West to East. Average values for the four years of study were: Colonia del Sacramento, (plots 1 and 2) 22.04 MJ*m-2*day-1, Punta Yeguas (plot 5) 21.83 MJ*m-2*day-1, Sierra Mahoma (plot 3) 21.75 MJ*m-2*day-1, Juanicó (plot 4) 21.62 MJ*m-2*day-1, Atlántida (plots 6 and 7) 21.58 MJ*m-2*day-1 and Laguna del Sauce (plots 8 and 9) 21.14 MJ*m-2*day-1. These values were not significantly different.
When the evolution of irradiation for each site was discriminated per year, interannual variability was greater than spatial variability. However, the decreasing trend in irradiation along the coast from West to East was verified for each of the four years studied (Figure 2).
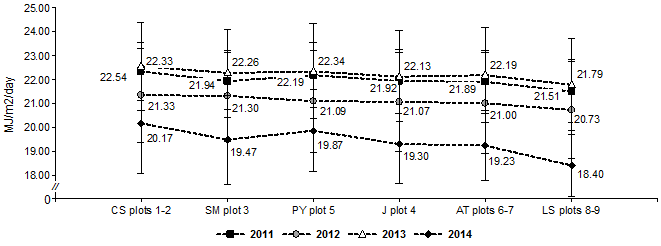
Figure 2. Variation of the daily mean solar irradiation as a function of site and year. Sitesfrom West toEast: CS= Colonia del Sacramento, SM=Sierra de Mahoma, PY=Punta Yeguas, J=Juanicó, AT=Atlántida, LS=Laguna del Sauce. Years: 2011, 2012, 2013 and 2014. Each value corresponds to the average of the daily irradiation form September 1st to 31st March. Error bars indicate the standard deviation
Table 4. Daily solar irradiation averaged for February in each of the studied years and corresponding Standard deviation (n=24).
| Year | Irradiation February (MJ*m-2*day-1) |
| 2011 | 23.93± 0.59 a |
| 2012 | 21.20 ± 0.94c |
| 2013 | 22.65 ± 0.69 b |
| 2014 | 17.33 ±0.33 d |
During February, when the maturation of most of the red grapevine cultivars in the region is taking place, irradiation showed significant differences among years. The highest value was observed in 2011 whereas the lowest one was found in 2014, with a difference of 27.87% between them (Table 4).
Values followed by different letters are significantly different according to the Tuckey test (p<= 0.05)
The annual dynamics of irradiation in the two most distant sites (Figure 3) displayed different shapes of energy accumulation over a growing season, as well as a monthly difference between sites. The maximum levels of irradiation were reached in December for the years 2011 and 2014 and in January for 2012 and 2013.
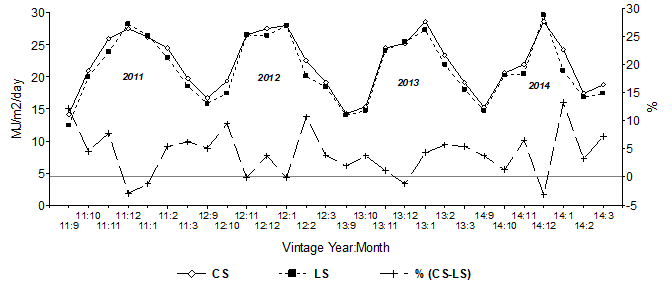
Figure 3. Dynamics of the monthly average of daily solar irradiation as a function of site and year. The two most distant sites and the four years studied are represented: CS= Colonia del Sacramento, plots 1-2 (to the West) and LS=Laguna del Sauce, plots 8-9 (to the East). The % (CS-LS) variable represents the percentage of the difference between the irradiation for CS against that of LS.
3.3. Correlation Between Solar Irradiation with the Multicriteria Climate Classification System (MCCS) Indices
3.3.1. ISA (Dryness Index Adapted)
Average irradiation for February, key period of berry maturation, is negatively correlated with ISA. When the values of irradiation for this month are higher than 19.05 MJ*m-2*day-1, the ISA index changes from "Sub-humid" to "Moderately dry" (Figure 4A).
3.3.2. Cool night Index (CIA)
The correlation between irradiation in February and CIA showed a very low level of fitting (R²=0.10), proving that a high degree of independence exists between this thermal index (linked to daily minimum temperature) and solar energy.
3.3.3. HIA (Heliothermal Index Adapted)
HIA (Heliothermal Index Adapted) showed a strong correlation with solar irradiation (Figure 4B).
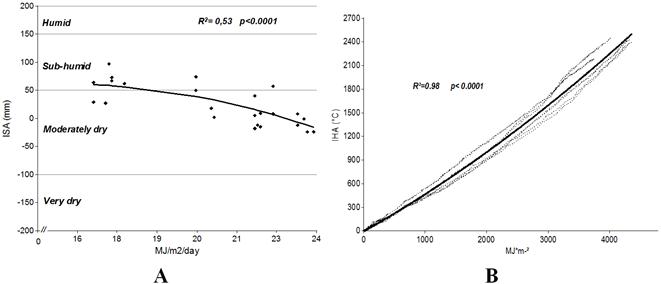
Figure 4. (A) Regression between February average daily solar irradiation and ISA (mm), in vineyards from six regions of the coast of the Río de la Plata (Y= - 1.13x2 + 35.48x – 215.71; n=27; R2= 0.53; p<0.0001).(B) Regresion between cumulated irradiation and the HIA between 01/09 and 15/03, for Colonia del Sacramento (plots 1-2) and Juanicó (plot 4) sites. In both (A) and (B) data corresponds to the 2011, 2012, 2013 and 2014 growing seasons.
Daily cumulation of HIA was modelled with the following equation:
Y = 0.00003x2 + 0.44x – 6.6 (R2=0.98; p< 0.0001; N=1440)
Where "x" represents the daily value of cumulated solar irradiation on the surface.
From the former equation, the solar irradiation intervals corresponding to the HIA classification were calculated (Table 5).
Table 5. Correspondence among irradiation intervals and HIA according to the MCCS.
| Viticultural climate Index HIA | Irradiation class intervals (MJ*m2) |
| Class | Acronym | Class interval (°C) |
| Warm | HIA5 | 2400-3000 | 4242,41 - 5076,26 |
| Temperate warm | HIA4 | 2100-2400 | 3802,10 - 4242,41 |
| Temperate | HIA3 | 1800-2100 | 3343,65- 3802,10 |
| Cool | HIA2 | 1500-1800 | 2864,60 - 3343,65 |
| Very cool | HIA1 | 1000-1500 | 2011,79 - 2864,60 |
The HIA intervals calculated with the equation for the solar irradiation accumulation were fitted to the actual HIA values for the four years. Estimated HIA values varied between 1990 ("Temperate") and 2503 ("Warm"), whereas the actual HIA values varied between 2085 ("Temperate") and 2430 ("Warm"). Although this equation allows for a rather precise estimation of the climate type (Y= 1.22x -534.42; R²=0.51; N=27), irradiation values lower than 4200 MJ/m2 underestimate HIA at harvest, whereas higher irradiation values overestimate this index.
3.4. Study Case at the Vineyard Level
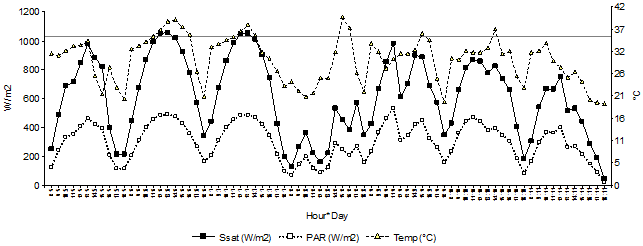
Hourly evolution of solar irradiation (from satellite images), between 8h and 18h, PAR and canopy temperature during the week from 5/1/2011 to 11/01/2011 in a vineyard from Atlántida, Uruguay, is shown in Figure 5A. In average, the energy of PAR represented 48.31% of solar irradiation on the surface.
A regression line between solar irradiation and daily temperature was fitted:
Y= 0.01x + 21.72; R2= 0.50; N=77; p-value <0.0001
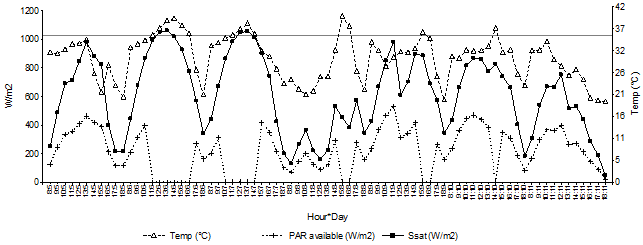
In Figure 5B, the available hourly PAR, or energy below 35°C, is represented.
A
B
Figure 5. Hourly evolution (between 8h and 18h) of (A) solar irradiation, PAR and canopy temperature; and (B) useful PAR and canopy temperature. Timespan 05.01.2011 to 11.01.2011. Site: Plot 6, Atlántida, Canelones.
Table 6. Cumulative daily values of solar irradiation, useful PAR and proportion between them.
| Day | Irradiation (MJ*m-2*day-1) | Useful PAR (MJ*m-2*day-1) | Useful PAR /Daily irradiation (%) |
| 05.01.2011 | 23.4 | 11.5 | 49.1 |
| 06.01.2011 | 31.4 | 4.9 | 15.6 |
| 07.01.2011 | 30.4 | 5.8 | 19.3 |
| 08.01.2011 | 13.1 | 5.3 | 40.0 |
| 09.01.2011 | 27.5 | 10.4 | 38.0 |
| 10.01.2011 | 26.0 | 11.1 | 42.6 |
| 11.01.2011 | 17.8 | 9.1 | 51.2 |
The highest amount of useful PAR was reached with a daily solar irradiation cumulated from 8h to 18h of 21.22 MJ*m-2*day-1 (Y= -0.09x2 +3.82x -30.55; R2=0.92; p-value < 0.001). Higher values of daily irradiation would be associated to high temperatures and to a reduction in available PAR. In the seven days analyzed, the proportion of useful PAR represented 35.2% of the total energy received (Table 6).
4. Discussion
4.1. Irradiation and Climate
The results from the regression analysis between solar irradiation and temperature, ETo, relative humidity and sunshine duration confirmed the strong relationship among these variables and incoming energy on the surface. According to Priestley and Taylor [19], ETo was positively correlated with irradiation. Apart from solar irradiation, all the climate variables are affected by other climate components such as atmospheric circulation and geographical factors that explain a portion of their variability. In the studied region, the geographical factor with the greatest influence is the sea and the sea-land breezes [10]. The effect of this phenomenon in the coastal regions would be manifested in a reduction of the daily temperature variability and an increase in relative humidity with respect to an inland region, according to works performed in South Africa [38] [39].
In addition, cloudiness also affects the loss of energy from the earth and, consequently, surface temperature, limiting the incoming solar radiation and the outcome of thermal energy.
The relevance of knowing the cumulated irradiation and its distribution relies on the fact that, from their analysis, it would be possible to infer light, temperature and humidity conditions in which a crop is developed.
4.2. Spatial Distribution of Irradiation
The results of mean irradiation for each location presented a decreasing trend from West to East. These results are in agreement with those reported by Abal et al [28] in Uruguay. It is likely that the lowest irradiation on the East of the coast during the months of grapevine vegetative development is a result of an increase in cloudiness and relative humidity due to sea influence [40].
The analysis of irradiation per year and location reflected the same geographical trend. This difference was more evident on the geographic endpoints, although they are located at a similar latitude (-0° 21’). According to Buttrose [20], Smart [13] and Makra et al [27], differences on net irradiation should correlate with plant functioning. In this work, the differences in cumulative daily irradiation between the most distant locations would be theoretically equivalent either to a delay of 6-7 days in the growing cycle for a given cultivar, or, approximately, 0.4°-0.5° of probable alcoholic grade if harvest would take place on the same date for both locations [32].
Irradiation spatial variability showed trends that allowed for discriminating viticultural regions along the Río de la Plata coast, in the same way as performed in Lombardy [26] and Bordeaux [25]. In contrast to what was found in those cases, where topography was a determinant factor, in the coast of Río de la Plata the most relevant factor was sea influence.
4.3. Solar Irradiation and Climate Indices from the Multicriteria Climate Classification System (MCCS)
According to Van Leeuwen et al. [6], climate and soil affect grapevine through determining its water status. The ISA index, that estimates water availability for plants during a growing cycle, was negatively correlated with the average daily irradiation of February. The studied soils present a low to medium water holding capacity (between 47.6 and 105.5 mm), due to their differences in texture and high percentages of clay that reduce water infiltration and root growth to deeper soil horizons. In this way, the soil volume where 90% of active roots are located determines that water balance over a growing cycle is highly dependent on the rainfall regime that occurs in the last stage of maturation. Moreover, the increase in rainfall is associated with lower irradiation levels. Under the studied conditions, when the average daily irradiation during February was over 18.38 MJ/m2*day-1, ISA corresponds to IS+1 "Moderately dry"; whereas when irradiation values are lower that this threshold ISA would be IS-1 "Sub humid". Interannual comparison showed that February of 2014, with an irradiation of 17.3 MJ/m2*day-1 was classified as "Sub humid" in all the studied sites, whereas in 2011, 2012 and 2013 ISA corresponded to "Moderately dry".
Regarding the two MCCS thermal indices, cool-night index showed a very low correlation with irradiation, similarly to the relationship between irradiation and minimum temperature. On the contrary, the heliothermal index presented a very high correlation with the daily cumulative solar irradiation. The good fitting between these two variables allows for the use of cumulative irradiation in a similar way to HIA and hence estimate the correspondence among the classification intervals for both variables. For instance, a cumulative irradiation between 3802.10 MJ/m2 and 4242.41 MJ/m2, from bud-break to harvest, corresponds to the classification "Temperate warm" or HI4 from MCCS. The estimation of HIA at harvest from solar irradiation, for a total of 27 harvests in 4 years averaged 2244.31°C and a coefficient of variation of 8.31%, whereas HIA calculated from the weather station observations averaged 2271.93°C and a coefficient of variation of 4.81%. The estimator generated values with higher heterogeneity than the actual values when these are calculated from temperature data. A greater number of years would result in a better fitting.
The six study sites are located within three climate regions, as discriminated byFerrer et al. [10] applying the MCCS. The relationships between solar irradiation and two out of the three MCCS indices suggests that the differences in solar irradiation spatial distribution could be one of the factors that explains the climate zoning for grapevine and wine production. The estimation of the energy received in different regions of the planet obtained by satellite imagery could be used for a regional or worldwide zoning of viticultural production.
4.4. Interannual Variability of Irradiation
Significant differences among years were detected for cumulative energy. According to its correlation with meteorological variables and with two out of three MCCS indices, the cumulated amount of solar energy allowed for establishing that light and temperature conditions were higher in 2011 and 2012, whereas relative humidity and water balance were lower in those years than in 2014.
The dynamics of monthly solar irradiation level for each vintage correlates with vine growing kinetics and other plant responses. The difference between irradiation levels occurred in February could have caused different conditions for berry composition according to Dokoozlian and Kliewer [21], Spayd et al. [22] and Tarara et al. [23]. In addition, changes in the length of the maturation period and on disease or pest incidence could be expected.
These results proved that including solar irradiation in this kind of studies would allow for discriminating years according to their amount and profile of solar irradiation and, thus, be used for characterizing a given vintage, such as performed by Makra et al. [27] in Tokaj. This methodology would be comparable with the traditional determination of the "vintage effect" from climate variables in the sense pointed out by Blouin and Guimberteau [1]. This influence would be manifested in yield variability as well as in differences in berry size and composition [24] [2] [3] [4], since this effect is greater than genetics or management practices [5], thereby affecting the economy of winemaking enterprises.
4.5. Solar Irradiation, PAR and Canopy Temperature
Solar irradiation influences plant life mainly through its thermal effects and photosynthesis [41] [42]. The relationship between global PAR and global solar irradiation (estimated through satellite images) for hourly values was 48.31% in the case of Atlántida, Uruguay (34° 39’ S, 55° 47’ W). This proportion lies within the thresholds reported by Li et al. [16] and Jacovides et al. [17] for hourly values during summer and the value obtained by Escobedo et al.[43]. However, it was higher than the proportion obtained by Yu et al. [18] for daily values. Apart from this percentage, a direct relationship between solar irradiation and PAR exists (R2=0.98, p-value <0.0001).
Nevertheless, this relationship is not direct when the proportion of useful PAR, as a function of a threshold of 35°C maximum temperature, is taken into account since from this threshold plant photosynthesis would be stopped. Considering this limitation allows for establishing that useful PAR increases with daily solar irradiation till a maximum of 21.22 MJ*m-2*day-1. When the value of daily solar irradiation surpasses this threshold, the absolute amount of useful PAR begins to decrease by the effect of high temperatures associated with the increasing irradiation (combined effect light-temperature). In the short term and at mesoscale, other factors that affect temperature, such as atmospheric circulation, topography, sea-land breezes or cloudiness will modulate this dependence on solar irradiation.
Under the conditions of the current study, it can be concluded that for two sites with similar irradiation values, such as what happened in 2011 in Punta Yeguas and Sierra Mahoma, the close proximity to the sea of Punta Yeguas (0.8 km) with respect to Sierra Mahoma (41 km) and the consequent reduction in maximum temperatures would have generated a higher amount of useful PAR and conditions for a greater dry matter production and sugar accumulation in the berries [20].
5. Conclusions
Solar irradiation over large territories can be reliably estimated by satellite imagery. From this information, long-term hourly solar irradiation series can be obtained and used for generating cumulative daily values, monthly and historical averages.
A high correlation between irradiation and temperatures, reference evapotranspiration, sunshine duration and relative humidity was demonstrated. Moreover, a relationship between solar irradiation and two indices from the MCCS was proven.
Cumulative irradiation and its annual distribution profile could be used for discriminating the interannual variability of environmental conditions over a vintage and associate product quality to pre-established solar energy intervals.
According to the results, it would be possible to perform a regional or worldwide viticultural zoning on the basis of irradiation estimated through satellite images. In contrast with the viticultural regionalization exclusively based on climate indices, the proposed method also provides information about the incoming energy for photosynthesis and all grapevine physiological processes.
Acknowledgments
We thank Ph.D. Ing. Agr. Elena Beyhaut and Ph.D. Ing. Agr. Santiago Dogliotti for comments that greatly improved the manuscript.
References
- Blouin, J., &Guimberteau, G. 2000. Maturation etmaturité des raisins. Editions Féret, Bordeaux. Francia.
- Fischer, U., Roth, D., Christmann, M. 1999. The impact of geographic origin, vintage and wine estate on sensory properties of Vitisvinifera cv. Riesling wines. Food Quality and Preference, 10 (4), 281-288.
- González-Neves, G., Ferrer, M., Gil, G. 2012. Differentiation of Tannat, Cabernet Sauvignon and Merlot grapes from Uruguay according to their general composition and polyphenolic potential. Comunicata Scientiae, 3 (1), 41-49.
- Fernández Gómez, O., Baeza Trujillo, P., Junquera González, P., Lissarrague Garcia-Gutierrez, J. R. 2013. Efectos de las diferentes estrategias de riego en la composicióndel vino y superfil sensorial (Vitisvinifera L., cv. Cabernet sauvignon). In: "Congreso de los Grupos de InvestigaciónEnológica", 18/06/2013 - 21/06/2013, EscuelaTécnica Superior de IngenierosAgrónomos de la Universidad Politécnica de Madrid. p. 1.
- Ferrer M., Echeverría G., Carbonneau A. 2014. Effect of berry weight and its components on the contents of sugars and anthocyanins of three varieties of Vitisvinifera L. under different water supply conditions. South African Journal of Enology and Viticulture, 35 (1), pp. 103-113.
- Van Leeuwen, C., Friant, P., Chone, X., Tregoat, O., Koundouras, S., Dubourdieu, D. 2004. Influence of climate, soil, and cultivar on terroir. American Journal of Enology and Viticulture, 55 (3), 207-217.
- INAVI. Instituto Nacional de Vitivinicultura, 2015. http://www.tannatalmundo.com.uy/articulos/681-38-estadisticas-de-viñedos-datos-departamentales-2015.html
- Li, Y., & Chao, J. 2016. An Analytical Solution for Three-Dimensional Sea–Land Breeze. Journal of the Atmospheric Sciences, 73 (1), 41-54.
- Tonietto J.; Carbonneau A. 2004. Multicriteria climatic classification system for grape-growing regions worldwide. Agricultural and Forest Meteorology 124, 81-93.
- Ferrer, M., Pedocchi, R., Michelazzo, M., González Neves, G. Carbonneau, A. 2007. Delimitación y descripción de regiones vitícolas del Uruguay en base al método de clasificación climática multicriterio utilizando índices bioclimáticos adaptados a las condiciones del cultivo. Agrociencia, 11 (1), 47-56.
- Dedieu, G., Deschamps, P. Y., Kerr, Y. H. 1987. Satellite estimation of solar irradiance at the surface of the earth and of surface albedo using a physical model applied to Meteosat Data. Journal of Climate and Applied Meteorology, 26 (1), 79-87.
- Rabbinge, R. 1993. The ecological background of food production. In Ciba Foundation Symposium 177-Crop Protection and Sustainable Agriculture (pp. 2-29). John Wiley & Sons, Ltd..
- Smart R. E. 1989. Solar radiation interception as a guide to the design of horticultural plantings. II twenty years experience with grapevines. ISHS ActaHorticulturae 240: Australian Temperate Fruits Review Conference ISBN 978-90-66053-63-2, ISSN 0567-7572 Vol 1 Roseworthy, Australia.
- Ponzoni, F. J.; Shimabukuro, Y. E. 2009. Sensoriamento no estudo da vegetação.1ª Edição. São José dos Campos: Parênteses.
- Goudriaan J., Van Laar H. H. 1994. Modelling Potential Crop Growth Processes Textbook with Exercises. Kluwer Academic Publishers, Dordrecht, The Netherlands, Volume 2 1994. pp. 238.
- Li, L., Xin, X., Zhang, H., Yu, J., Liu, Q., Yu, S., Wen, J. 2015. A method for estimating hourly photosynthetically active radiation (PAR) in China by combining geostationary and polar-orbiting satellite data. Remote Sensing of Environment, 165, 14-26.
- Jacovides C. P., Tymvios F. S., Asimakopoulos D. N, Theofilou K. M., Pashiardes S. 2003. Global photosynthetically active radiation and its relationship with global solar radiation in the Eastern Mediterranean basin. Theoretical and Applied Climatology. 74, (3), 227-233.
- Yu X, Wu Z, Jiang W, Guo X. 2015. Predicting daily photosynthetically active radiation from global solar radiation in the Contiguous United States. Energy Convers Manag 89 (0): 71–82. doi: 10.1016/j. enconman.2014.09.038.
- Priestley C., Taylor R., 1972. On assessment of surface heat flux and evaporation using large-scale parameters, Monthly Weather Review, 100, 81-92.
- Buttrose, M. S. 1969. Vegetative growth of grapevine varieties under controlled temperature and light intensity. Vitis, 8: 280-285.
- Dokoozlian N, Kliewer W., 1996. Influence of light on grape berry growth and composition varies during fruit development. Journal of the American Society for Horticultural Science, 121, 869-874.
- Spayd S., Tarara J., Meed., Ferguson J., 2002. Separation of sunlight and temperature effects on the composition of Vitisvinifera cv. Merlot berries. American Journal of Enology and Viticulture, 53, 171-182.
- Tarara, J. M., Lee, J., Spayd, S. E., Scagel, C. F. 2008. Berry temperature and solar radiation alter acylation, proportion, and concentration of anthocyanin in Merlot grapes. American Journal of Enology and Viticulture, 59 (3), 235-247.
- Chaves M. 1981. Photosynthetic characteristics and environmental control in some grapevine cultivars. In Margaris NS and HA Mooney (eds): Components of Productivity of Mediterranean·ClimateRegions Basic and Applied Aspects. 1981 Dr W. Junk Publishers, The Hague/ Boston/London.
- Bois, B., Wald, L., Pieri, P., Van Leeuwen, C., Commagnac, L., Chery, P., Christen, M., Gaudillère, J.-., Saur, É. 2008, Estimating spatial and temporal variations in solar radiation within Bordeaux winegrowing region using remotely sensed data, Journal International des Sciences de la Vigne et du Vin, 42 (1), 15-25.
- Failla O., Mariani Ll., Brancardo L., Minelli R., Scienza A., Murada G., Mancini S., 2004. Spatial distribution of solar radiation and its effects on vine phenology and grape ripeningin an Alpine environment. American Journal of Enology and Viticulture, 55, 128–138.
- Makra, L., Vitányi, B., Gál, A., Mika, J., Matyasovszky, I., Hirsch, T. 2009, Wine quantity and quality variations in relation to climatic factors in the Tokaj (Hungary) winegrowing region, American Journal of Enology and Viticulture, 60 (3), 312-321.
- Abal G., D’Angelo M., Cataldo J., Gutiérrez A. 2011 Mapa solar del Uruguay versión 1.0 MemoriaTécnica, Departamento de Publicaciones, Unidad de Comunicación de la Universidad de la República (UCUR), Montevideo, Uruguay ISBN: 978-9974-0-0847-2 53p.
- Alonso-Suárez R, G. Abal, R. Siri, P. Musé. 2012. Brightness-dependent Tarpley model for global solar radiation estimation using GOES satellite images: Application to Uruguay, Solar Energy, 86 (11), 3205-3215, http://dx.doi.org/10.1016/j.solener.2012.08.012
- Alonso-Suárez R, G. Abal, P. Musé, R. Siri, 2014. Satellite-derived Solar Irradiation Map for Uruguay, Energy Procedia, 57, 1237-1246, http://dx.doi.org/10.1016/j.egypro.2014.10.072.
- Alonso-Suárez R, Bidegain M, Abal G, Modernell P. 2016. Año Meteorológico Típico para Aplicaciones de Energía Solar (AMTUes): series horarias típicas para 5 sitios del Uruguay. Memoria Técnica del LES/UdelaR, pags 143, versión 2.4, junio de 2016 – http://les.edu.uy/productos/amtues-2/
- Echeverría G., Ferrer M., Abal G., Alonso-Suárez R. 2015. Solar Radiation in the Uruguayan Coast of the Río de la Plata and its Relation to Viticulture Climate. Anales del Actualités Vitivinicoles journal (PAV) of the GiESCO (http://www.giesco.org). 19 th International Meeting GIESCO, Pech Rouge, Montpellier, 2015.
- Justus, C., Paris, M., Tarpley, J., 1986. Satellite-measured insolation in the United States, México, and South America. Remote Sensing of Environment 20, 57–83.
- WMO. 2008. Guide to meteorological instruments and methods of observation. Technical Report 8, World Meteorological Organization, WMO. 7th Ed.
- Pérez R., Seals R., Zelenka, A. 1997. Comparing satellite remote sensing and ground network measurements for the production of site/time specific irradiance data. Solar Energy 60 (2), 89-96.
- Ruiz-Arias, J. A., Alsamamra, H., Tovar-Pescador, J., &Pozo-Vázquez, D. 2010. Proposal of a regressive model for the hourly diffuse solar radiation under all sky conditions. Energy Conversion and Management, 51 (5), 881-893.
- Abal, G., Aicardi D., Alonso-Suárez R., Laguarda A. 2016. Estimation of ground-level diffuse irradiation in southern latitudes. Submitted in July 2016 to Solar Energy.
- Bonnardot, V. 2003. The sea breeze: a significant climatic factor for viticultural zoning in coastal wine growing areas. IV Symp. Intr. Zoning vit. 339-343.
- Myburgh, P. 2005. Effect of altitude and distance from the Atlantic Ocean on mean February temperatures in the Western Cape Coastal region. Wynboer Technical Yearbook, 2005, 49-52.
- Castaño, J. P; Giménez, A.; Ceroni, M.; Furest, J.; Aunchayna, R. 2009. Caracterización agroclimática del Uruguay 1980-2009. Instituto Nacional de Investigación Agropecuaria. Serie Técnica 193. Uruguay. 34p.
- Wang L, Gong W, Li C, Lin A, Hu B, Ma Y. 2013. Measurement and estimation of photosynthetically active radiation from 1961 to 2011 in Central China. Applied Energy 111 (0): 1010–1017. doi: 10.1016/j. apenergy.2013.07.001.
- Jones Hamlyn G. 2015. Plants and microclimate: a quantitative approach to environmental plant physiology. Cambridge university press, ISBN 978-0-521-27959-8.
- Escobedo J., Gomes E., Oliveira A., Soares J. 2011. Ratios of UV, PAR and NIR components to global solar radiation measured at Botucatu site in Brazil. Renew Energy; 36: 169–78.


