| 1. | ||
| 2. | ||
| 3. | ||
| 4. | ||
Effect of the Orientation Angle on Effusion Thermal Performance
Mowafaq S. Alwan1, Humam K. Jalghaf2, *, Reyadh Ch. Al-Zuhairy3
1Computer Engineering, AL-Iraqia University, Baghdad, Iraq
2Mechanical Engineering, University of Technology, Baghdad, Iraq
3Ministry of Higher Education and Scientific Research, Baghdad, Iraq
Email address
 (H. K. Jalghaf)
 Citation
Mowafaq S. Alwan, Humam K. Jalghaf, Reyadh Ch. Al-Zuhairy. Effect of the Orientation Angle on Effusion Thermal Performance. American Journal of Energy and Power Engineering. Vol. 3, No. 3, 2016, pp. 19-25.
Abstract
The present work concentrates the experimental investigation of effusion cooling performance for different holes direction at different blowing ratio. The film cooling effectiveness and local heat transfer coefficient for difference holes density have been investigated on a flat plate. The investigations were done by using a single test transient IR thermography technique. Two models of staggered holes arrangement are investigated. The holes diameter is 4mm, the longitudinal distance (X/D) is (5D), and the span distance between two neighboring holes (S/D) are 3D. The attitude of the holes is varied at inclination angle (θ = 30º) and the orientation angle (γ=0º) with (model 1) and opposite direction (θ = 30º, γ=180º) for (model 2) of hot main stream. The blowing ratios, cold to hot air flow ratio, have been changed three times (BR= 0.5, 1.0, and 1.5) during the experimental program. The experimental investigation shows that, when the flow of coolant air and hot mainstream are in the same direction provides significant reduction of heat flux at all tested BR than that of the flow direction of the coolant air is opposite to the direction of hot mainstream.
Keywords
Effusion Cooling, Blowing Ratio, Effectiveness, Orientation Angle
1. Introduction
Gas turbine engines are designed to perform at high inlet temperatures of (1,800 – 2,000 K), which are much higher than the allowable metal temperatures [1]. And higher turbine inlet temperature requires introduction of new materials and / or the usage of efficient means and methods of turbine blades cooling to maintain the blades below thermal failure condition during operation.
Film cooling is a technique used extensively in turbo machinery. In such situation, coolant air is taken from the compressor and injected through single or multiple rows of holes into the high temperature boundary layer on the blade surface. Because the coolant represent a loss in the output power, the designers objective is, therefore, to minimize the coolant necessary to ensure adequate turbine life by an efficient blade cooling. The efficiency of this technique depends on several parameters such as the injection blowing ratio, the density ratio, the mainstream turbulence intensity, the mainstream pressure gradient, the boundary layer thickness, the injection angle, the spacing of the holes and their arrangement, and the blade geometry [2]. In a typical gas turbine blade, the range of the blowing ratios are of about approximately between 0.5 and 2.0, while the (Tc/Tm) values vary between 0.5 and 0.85 [3].
Effusion (or transpiration) cooling, which contains an array of closely spaced discrete film cooling holes, is widely used to cool and insulate the component metal from the hot mainstream flow. The cooling effectiveness of an effusion cooling plate depend on several parameters, such as hole spacing, angle, diameter, etc.
Review on turbine cooling technology developments has been well described by Han et al. [4] and Bunker [5] which covering of all the available technologies on film cooling. Han and Rallabandi [6] stated that the pressure sensitive paint technique proved very high resolution contours of film cooling effectiveness, without being subjected to the conduction error in high thermal gradient regions near the hole. Andrews et al. [7] investigated (90 deg.) cooling hole for a number of different arrays and found that there was a significant improvement in the overall cooling effectiveness for a larger hole relative to a smaller hole. Andrews et al. [8] also compared normal (90 deg.) and inclined film holes (30 deg. and 150 deg.) for an array of effusion holes and found that cooling effectiveness improved with inclined holes. The counter flow holes (150 deg.) resulted in reverse flow and good cooling performance at low coolant flows but not at high coolant flows.
Lu et al. [9 and 10] presented the experimental and numerical investigation of film cooling performance for a row of cylindrical holes in modern turbine blade. The adiabatic film effectiveness and heat transfer coefficient are determined experimentally on a flat plate downstream of a row of inclined different geometries hole exit by using a single test transient IR thermograph technique at four different coolant-to-mainstream blowing ratios of 0.5, 1.0, 1.5 and 2.0. Four test designs crescent and converging slot, trench and cratered hole exits, are tested. Results showed that both the crescent and slot exits reduce the jet momentum at exit and also provide significantly higher film effectiveness with some increases in heat transfer coefficients.
Martiny et al. [11] used a very low injection angle of (17 deg.) for an effusion, film cooling plate in which they measured adiabatic effectiveness levels for a range of blowing ratios. Their results indicated significantly different flow patterns depending on the cooling jet blowing ratio. It is important to recognize that their study used only four rows of cooling holes and as will be shown in this paper, this small number of rows did not allows for a fully developed condition to occur.
Gustafsson and Johansson [12] investigated the temperature ratios and velocity ratios between hot gas and coolant, and different injection hole spacing, inclination angle, and thermal conductivity of the test plate.
Ekkad et al. [13] obtained both film cooling effectiveness and heat transfer coefficient from a single test by means of the transient infrared thermography technique. The advantage of IR technique was exhibited adequately in these previous research efforts. In terms of the wider temperature range handled than the liquid crystal technique and more detailed 2D temperature field information with better accuracy. It is seen that these research with successful employed of the IR technique enriched higher quality data in the literature, but the effect of the deflection angle of the injection holes was not attempted.
Dhungel et al. [14] obtained simultaneously detailed heat transfer coefficient and film effectiveness measurements using a single test transient IR thermography technique for a row of cylindrical film cooling holes, shaped holes. A number of anti-vortex film cooling designs that incorporate side holes. They found that the presence of anti-vortex holes mitigates the effect of the pair of anti-vortices.
Numerical prediction of Alwan [15] showed that the flow field structure of injected holes present vortices, such as counter pair kidney vortex and horseshoe vortex have major effects on cooling performance, in which the strength of the kidney vortex decreases and the horseshow vortex is lifting up, leading to an improvement in the coolant performance. Therefore, numerical model is suitable to design holes arrangement futures of film cooling system by introducing oriented holes row over single jet holes row.
At the present work, experimental investigations were done to evaluate the film cooling performance for different hole space ratio and different blowing ratio in order to determine the heat transfer coefficient and the film cooling effectiveness on a flat plate by using a single test transient IR thermograph technique.
2. Experimental Facilities
A schematic diagram and photography of the low speed open duct jet test rig is shown in figure (1) was used at the current investigation. The mainstream air supply is the ambient air drawn by a blower. The blower is of 2.5 kW motor running with 2800 rpm. Manual open gate is used to control the air speed in the test section. The blower exit area having rectangular shape with dimensions of (6.3x13.1) cm. The blower is supplied with bend having the same dimensions of the blower exist and then connected to a diffuser having rectangular cross-section area of inlet and outlet dimensions as (6.3x13.1) cm and (35x50) cm respectively and length of (82) cm. Air flow diffuses over a splitter plates into a constant area rectangular settling chamber of cross-section area (35x50) cm and length of 70 cm.
The settling chamber contains a series of three electrical heaters and four grid screen. This ensures adequate mixing of hot air and uniform temperature distribution throughout the test section. Then the hot air routed through a convergent-divergent contraction having a rectangular cross-section area from (35x50) cm to (5x10) cm and length of 70 cm. In order to allow the air to reach the desired temperature, the air is initially routed out away from the test section by using a by-bass gate passage. The temperature of the air is continuously monitored at the exit of the gate and when the desired temperature is reached, the gate is fully opened manually and air flow passes into a test section through a rectangular duct area. To minimize heat losses to the surrounding, the settling chamber and the test section duct are insulated completely. The operating velocity of the hot air in the test section is controlled to run as (13.333, 20, and 40 m/s) through the experimental program.
A centrifugal air blower of blowing capacity of (22.17) m3/min was used to supply the coolant air to the plenum. The plenum was located below the test plate. The coolant air enters a plenum then ejected through holes into the test section. The coolant air pressure measured at the inlet of the test section. The coolant air injected from the holes is mixed with the hot mainstream in the test section. The test section has 5 cm width, 10 cm height and 23.4 cm length. The bottom wall of the test section work as a test model.
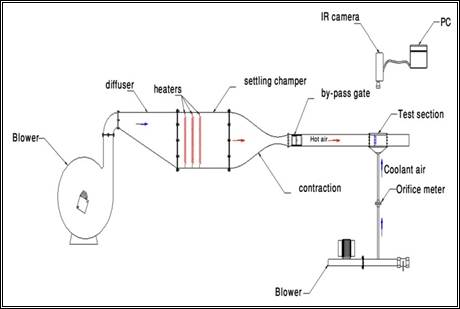
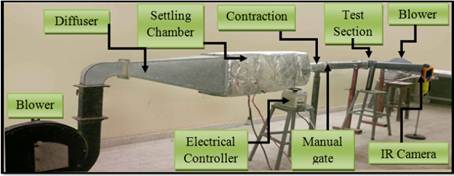
Figure 1. Schematic and photography of the experimental rig.
Two models with different holes direction (as shown in figure (2)) are prepared. The bottom model plate can be removed easily to be replaced by another model at each test. Each model is provided with five columns of holes, these models are arranged with staggered row holes. The holes diameter is 4mm, the longitudinal distance (X/D) is (5D), and the span distance between two neighboring holes (S/D) are 3D. The attitude of the holes is varied at inclination angle (θ = 30º) and the orientation angle (γ=0º) with (model 1) and opposite direction (θ = 30º, γ=180º) for (model 2) of hot main stream. The inclination angle (θ) is defined as the angle between the centerline of the hole and the surface of the test wall and the orientation angle (γ) is defined as the hole orientation towards the cross-flow in the mainstream, as illustrated in Figure 3 and Figure 4 which shows the jets hole inclination and orientation angles according to the coolant flow direction. The blowing ratios, cold to hot air flow ratio, have been changed three times (BR= 0.5, 1.0, and 1.5) during the experimental program.
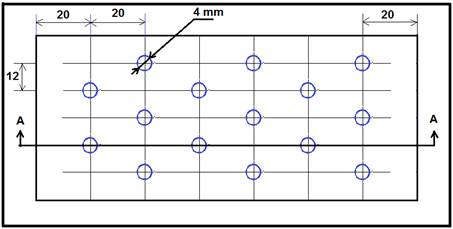
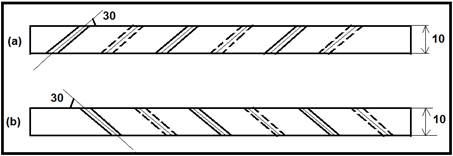
Figure 2. Schematic of (a) model 1 and (b) model.
The hot mainstream and injected coolant air temperatures are measured by using digital thermometer with the aid of thermocouples type-K. The coolant temperature is measured inside one chosen hole since pre-testing showed that all film holes had the same flow rate and temperature conditions. A 14mm diameter orifice plate meter is used to measure the coolant air flow rate. A standard ellipsoidal nosed Pitot- static tube with curved junction is used to measure the mainstream air velocity.
The surface temperature of test model was measured using an infrared thermographs technique. IR thermograph infrared camera type Fluke Ti32 was used in the present investigation. This camera is able to precisely record the temperature variations. The IR system is greatly affected by both background temperature and local emissivity. The test surface is sprayed with mat black color to increase the emissivity like a perfect black body. The temperature measurement taken is not accurately recorded unless the IR system is calibrated.
The system was calibrated by measuring the temperature of the test surface using thermocouple type K and the reading of IR camera. The test surface is heated by mainstream hot air. The measured temperatures obtained by both ways are recorded and stored during the heating process until achieving a steady state condition. Due to the emissivity of the test surface, the temperature obtained by IR camera is different from the temperature obtained by the thermocouple. Therefore, the IR camera reading is adjusted until both temperature readings are matched.
The IR images taken for the test surfaces at each test are stored in the SD memory of IR camera. These images are transferred from SD memory to PC memory. Then the middle region of the test surface area is then selected to eliminate the effect of the test section wall with using camera software, Smart View Software Program. IR images, which exhibit the temperatures distribution as colors code, is converted to corresponding temperature digit values by using Smart View Software and then saved as output data in Excel sheet.
Estimating Heat Transfer Parameters
The test plate is modeled as infinitely thick flat plate under a transient heat transfer phenomenon. The test plate is initially at a uniform temperature (Ti) at time, t = 0. At time t>0, the flat plate is suddenly exposed to a stream of hot air of temperature (Tm).
The warm stream of air provides a heat flux to the surface of the flat plate and convective heat transfer phenomenon occurs. Balancing thermal energy in the surface of the test plate yields the following equations:
![]() (1)
(1)
Neglecting the lateral conduction, above equation reduces to:
![]() (2)
(2)
Two boundary conditions are needed and an initial condition to solve this partial differential equation, such as:
At t=0, T=Ti
The first boundary condition is at the wall surface,
At x=0 ![]() and t ≥ 0.
and t ≥ 0.
The main assumption applied to analyze the transient conduction is the semi-infinite approximation; it means that the test plate is a thick wall in which one end is not affected by the boundary condition at the first end. This means the thermal wave applied to one end does not reach the other end duration. Therefore, the semi-infinite solid assumptions give an additional boundary condition,
At x = ∞, T=Ti and t ≥ 0.
Combinations of the above reasons make sure that heat is conducted only in one-direction (x-direction) and it does not reach the bottom of the test surface.
Solving equation (2) with the prescribed initial condition and boundary conditions gives a non-dimensional temperature term which is the convective boundary surface [16].
![]() (3)
(3)
Note that erfc (∞) = 0 and erfc (0) = 1. T = Tw at (x=0, t ≥ 0) can be obtained by substituting x = 0 into equation (3) and expressed as:
![]() (4)
(4)
Where (![]() ) is the wall temperature being measured with IR camera. The initial temperature (
) is the wall temperature being measured with IR camera. The initial temperature (![]() ) of the test surface and the mainstream temperature (
) of the test surface and the mainstream temperature (![]() ) can be measured before and during test respectively. The properties of test surface (
) can be measured before and during test respectively. The properties of test surface (![]() and α) are also known. For infrared technique,
and α) are also known. For infrared technique, ![]() is the time when the IR image was taken after the test was initiated. Therefore, the heat transfer coefficient (
is the time when the IR image was taken after the test was initiated. Therefore, the heat transfer coefficient (![]() ) can be determined.
) can be determined.
Considering the injected coolant air being from the bottom of the plate surface, now in addition to the mainstream flow, secondary flow is also presented. In this case three different temperatures are to be considered, such as the mainstream temperature (![]() ), the coolant temperature (
), the coolant temperature (![]() ) and the wall temperature (
) and the wall temperature (![]() ). In film cooling situations, the mainstream in equation (4) must be replaced by a film temperature (
). In film cooling situations, the mainstream in equation (4) must be replaced by a film temperature (![]() ), the following equation as given by the following reference can be used to estimate
), the following equation as given by the following reference can be used to estimate![]() :
:
![]() (5)
(5)
In which ![]() is a mixed temperature between the mainstream and the coolant temperature and is expected to be in the range of (
is a mixed temperature between the mainstream and the coolant temperature and is expected to be in the range of (![]() >
>![]() >
>![]() ). To determine the unknown (
). To determine the unknown (![]() ), a non-dimensional temperature is defined as the film cooling effectiveness (
), a non-dimensional temperature is defined as the film cooling effectiveness (![]() ):
):
![]() (6)
(6)
The maximum value of this term could take unity and that it is when the film temperature is equal to the coolant temperature. If the film temperature is equal to the warm mainstream temperature (without film cooling), the value of (![]() ) is zero.
) is zero.
From equation (5) and (6), the following equation can be obtained:
![]() (7)
(7)
This equation is a function of two unknowns η and h, and with respect to equation (5), also this equation is a function of two unknowns (![]() ) and (
) and (![]() ), therefore to determine both unknowns η and h, two data points are needed. Thus in the transient test, the wall temperature is (
), therefore to determine both unknowns η and h, two data points are needed. Thus in the transient test, the wall temperature is (![]() ) at time t1, and at time t2 the wall temperature is at (
) at time t1, and at time t2 the wall temperature is at (![]() ). Therefore two unknowns can be found from the following equations:
). Therefore two unknowns can be found from the following equations:
![]() (8)
(8)
![]() (9)
(9)
In the current study, a transient infrared thermograph technique described by Ekkad [17] can be used to solve equations (8), (9) and then (![]() ) and (
) and (![]() ) and hence (
) and hence (![]() ) can be found out from a single test. In this test, two IR images at the same location of the surface temperature distributions are captured at two different times during the transient test. the term blowing ratio (BR) is used to study the effect of the amount of coolant flow to mainstream flow. It is defined as the ratio of the mass flux of the coolant to the mass flux of the mainstream.
) can be found out from a single test. In this test, two IR images at the same location of the surface temperature distributions are captured at two different times during the transient test. the term blowing ratio (BR) is used to study the effect of the amount of coolant flow to mainstream flow. It is defined as the ratio of the mass flux of the coolant to the mass flux of the mainstream.
![]() (10)
(10)
A net heat flux ratio is the ratio of heat flux to the surface with film cooling to the heat flux without film cooling. This term is used to measure the combined effect of film effectiveness and heat transfer coefficient [22].
![]() (11)
(11)
The IR images for models surfaces at each investigated test was captured and stored by thermal camera as image of temperature distributions. These images are transferred to PC. Smart View Software program supplied with Camera can be used to limit the selected area to avoid the effect of the test section. The IR images converted to corresponding temperature digital values and then saved as data in Excel sheet. MATLAB program Software is prepared using a semi-infinite solid assumption presented to solve the above equations (6, 8, 9 and 11). The data used to introduce the film cooling effectiveness and heat transfer coefficient contours from the selected area presented denoted by (![]() ).
).
The measurement uncertainty was determined by using the methodology described by Holman and Bhattacharyya [18]. Error estimates for each variable are as follows: wall temperature ∆Tw = ±2ºC, initial temperature ∆Ti = ±2ºC, mainstream temperature ∆Tm = ±0.2ºC, and coolant temperature ∆Tc = ±0.2ºC. The camera frame rate is 60 Hz resulting in a time error ∆t =±0.125 sec. and the test surface properties (α and k) uncertainty are taken from tabulated values, as a custom, 3% relative uncertainty is assumed for both variables. The resulting average uncertainty for heat transfer coefficient and film effectiveness is ±8.2% and ±11.0%, respectively.
3. Results and Discussions
Figures (3 to 5) show the effect of holes direction on the temperature distribution for different blowing ratios (BR= 0.5, 1.0, and 1.5). Comparison between model 1 and model 2 showed that the model 1 gave high protection than the model 2 for the low blowing ratios (BR= 0.5), while model 2 gave high production than model 1 for high blowing ratios (BR=1.0 and 1.5). Also figures (3 to 5) show that the coolant temperature distribution decreases as the blowing ratio increases for model 1, also show that the coolant temperature increases as the blowing ratio increases for model 2.
For model 1 at low blowing ratio (i.e. BR=0.5), the mainstream flow close to the test surface. Also, the jet streamlines seems to go towards the surface and the mainstream flow depart upward, therefore the mainstream push the jet towards the surface. For a high momentum ratio (i.e. BR=1.5), and since the momentum of the jet is relatively high, the jet is separated away into the mainstream. These results have the same trend as in the results obtained by Ref. [19, 20].
For model 2, the pressure of the coolant injected air on the upstream side of the hole is elevated, thus locally reducing the hot jet velocity; and pushing up the hot stream depending on the blowing ratio. On the downstream side of the hole, the pressure falls and locally increases the exit velocity. Therefore, interaction and diffusion of the injected air with hot stream provides moderate air film temperature flowing near the surface and covering wide area.
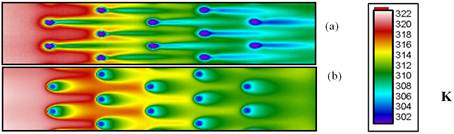
Figure 3. Contours of temperature distribution for: (a) model 1 and (b) model 2 at BR=0.5.
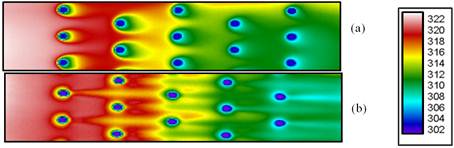
Figure 4. Contours of temperature distribution for: (a) model 1 and (b) model 2 at BR=1.0.
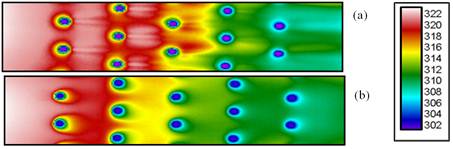
Figure 5. Contours of temperature distribution for: (a) model 1 and (b) model 2 at BR=1.5.
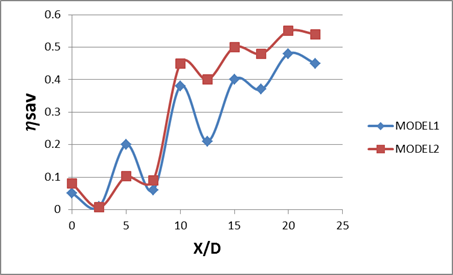
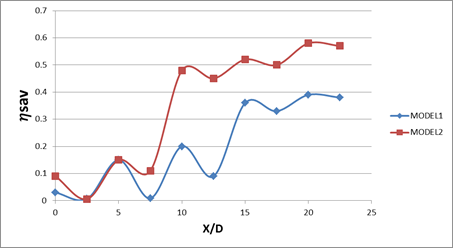
Figure (6) presents the span wise averaged film effectiveness (ηsav). (ηsav) is calculated as the average values taken from the local reading of 46 pixels in span wise direction in the center of the holes and the mid distance between two holes. Figures (6a, 6b and 6c) show that the model 1 gave high values of (ηsa) as compared to the model 2 for low blowing ratio (BR= 0.5), while for high blowing ratios (BR= 1.0 and 1.5) model 2 gave high values of (ηsa) as compared to the model 1.
The overall average film cooling effectiveness (ηav) was calculated from the values of local film cooling effectiveness (η). Figure (7) shows the effect of blowing ratio on (ηav) for low blowing ratio model 1 gave high values of (ηsa) as compared to the model 2, while for high blowing ratios model 2 gave high values of (ηsa) as compared to the model 1. It appears also that the values of (ηav) decreases as the blowing ratio increases for model 1, and increases as the blowing ratio increases for model 2.
As a matter of fact, the enhancement of the blade surface protection is done by keeping the local heat transfer coefficient (h) as low as possible. The local heat transfer coefficients are calculated from the data of two IR images taken in successive times as described above. The average of the local heat transfer coefficient ratios (h / ho), in which (h and ho) represent the heat transfer coefficient on the plate surface with and without film cooling respectively are presented in Figure (8). The values of the average heat transfer coefficient ratio for the model 1 are higher than that the model 2 for all blowing ratios and (h/ho) is increased with increasing the blowing ratio. The increment of (h/ho) is due to that the jet injection produces high turbulence level inside the mixing region.
In the practical application, turbine designers are concerned with the reduction of heat load to the film protected surface. The heat load can be presented by combining film cooling effectiveness (η) and the heat transfer coefficient ratio (h/ho), according to equation (13), therefore the ratio (q/qo) can be calculated. (q/qo) represent the reduction in heat flux at the tested surface with the presence of coolant air. If the values of these ratios are less than 1, then the film coolant is beneficial according to Ref. [21], while if the values are greater than 1, therefore effect of the film coolant is poor.
Figure (9) shows the effect of the blowing ratio on the overall heat flux ratios (q/qo). It is clear that from this Figure the model 1 provides significant reduction of heat flux at all tested BR than that of the model 2.
(a)
(b)
Figure 6. Effect of pitch spacing (X/D) on span wise averaged film cooling effectiveness at: (a) BR=0.5, (b) BR=1.0, (c) BR=1.5 for models (1, 2).
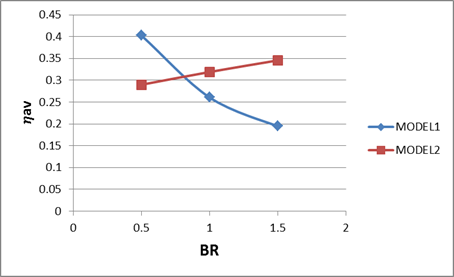
Figure 7. Effect of blowing ratio on averaged film cooling effectiveness for models (1, 2).
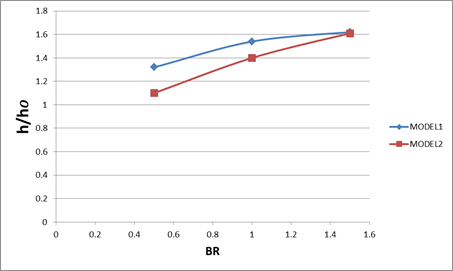
Figure 8. Effect of blowing ratio on averaged heat transfer coefficient for models (1, 2).
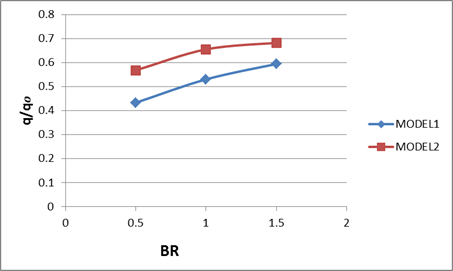
Figure 9. Effect of blowing ratio on overall heat flux ratio for models (1, 2).
4. Conclusion
The present work has reached to the following conclusions:
A Model 1 gave high values of the film cooling effectiveness (ηsa) as compared to the model 2 for low blowing ratio (BR= 0.5), while for high blowing ratios (BR= 1.0 and 1.5) model 2 gave high values of (ηsa) as compared to the model 1.
B The film cooling effectiveness decreases as the blowing ratio increases for model 1, and increases as the blowing ratio increases for model 2
C The values of the average heat transfer coefficient ratio (h/ho) for the model 1 are higher than that the model 2 for all blowing ratios and (h/ho) is increased with increasing the blowing ratio.
D The model 1 provides significant reduction of heat flux at all tested BR than that of the model 2.
Nomenclatures
| D | Hole diameter | m |
| h | Heat transfer coefficient with film cooling | W/m2 •K |
| ho | Heat transfer coefficient without film cooling | W/m2 •K |
| k | Thermal conductivity | W/m2 •K |
| S | Span wise hole spacing | m |
| SD | Secure Digital (memory card) | - |
| t | time | s |
| T | Temperature | °C |
| Tc | Coolant temperature | °C |
| Ti | Initial temperature | °C |
| Tm | Hot mainstream temperature | °C |
| Tw | Wall temperature | °C |
| Uc | Coolant velocity | m/s |
| Um | Hot mainstream velocity | m/s |
| η | Film cooling effectiveness | - |
| ηav | Average film cooling effectiveness | - |
| ηsa | Stream wise Average film cooling effectiveness | - |
| ρ | Density of air | kg/m3 |
| ρc | Density of coolant air | kg/m3 |
| ρm | Density of hot mainstream | kg/m3 |
| θ | Inclination angle | Degree |
References


