Post-Harvest Storage and Processing Changes in Carotenoids, Chlorophylls, and Micronutrients in Pterocarpus Mildbraedii
Felix Okpalanma1, Philippa Ojimelukwe1, Doris Akachukwu2
1Department of food Science and Technology, Michael Okpara University of Technology, Umudike, Abia State, Nigeria
2Department of Biochemistry, Michael Okpara University of Technology, Umudike, Abia State, Nigeria
Email address

(P. Ojimelukwe)
Citation
Felix Okpalanma, Philippa Ojimelukwe, Doris Akachukwu. Post-Harvest Storage and Processing Changes in Carotenoids, Chlorophylls, and Micronutrients in Pterocarpus Mildbraedii. AASCIT Journal of Biology. Vol. 2, No. 1, 2016, pp. 1-9.
Abstract
The aim of this study was to investigate the effects of ambient temperature storage (29±2°C) and domestic processing on the carotenoids, chlorophylls, vitamins and minerals in Pterocarpus mildbraedii leaves. Total β–carotene was determined spectrophotometrically while HPLC was used for detailed analysis of carotenoids. The results indicated that P. mildbraedii was rich in lutein (261.96µg/gdwt) and Total –β – carotene (83.53µg/gdwt). Cooking and storage significantly (P>0.05) increased the contents of total β – carotene. β –carotene isomerized more, due to thermal processing than storage. Initial concentrations of chlorophyll a, chlorophyll b and chlorophyll a/b ratio were 1.86 mg/gfwt, 0.72mg/gfwt and 2.44 mg/gfwt respectively. Preliminary nutritional data including the mineral elements (K, Ca, Mg, Zn and Fe) and vitamins contents (ascorbic and, riboflavin, thiamin, Niacin and phyllquinone) are presented. Cooking significantly decreased (P < 0.05) the contents of chlorophylls, water soluble vitamins and minerals. However, storage conditions in our study resulted in a non – statistical decrease in the contents of vitamins and minerals when compared with raw samples. The levels of β – carotene (Vitamin A), riboflavin, ascorbic acid and phylloquinone in cooked leave sample, are adequate to meet their corresponding RDAs in Children and adults respectively.
Keywords
Carotenoids, Minerals, Vitamins, Pterocarpus mildbraedii, β – carotene
1. Introduction
Pterocarpus mildbreadii belongs to the family Papilionaceae. It is a medium sized to large tree up to 35m tall with smooth gray or pale brown bark. The leaves are collected from the wild (sometime domesticated) but frequently marketed, [1]. Pterocarpus mildbraedii is a nutritive vegetable, but despite this, is only exploited as such in Southern Nigeria and are used as a cooked vegetable [2].
The health benefits or vegetables are well recognized, but the consumption are generally low [3], [4]. A study carried out to determine the consumption of fruits and vegetables in 10 Sub – Sahara Africa countries by [5] indicated that none of the countries reached FAO/WHO recommended minimum daily intake. Sub - Saharan Africa grows an enormous variety of leafy vegetables. In many parts of Africa, leafy vegetables are used as a side dish to accompany a thick starchy gruel that is primarily a carbohydrate source [6]. Vegetables are one of the most cost effective and sustainable solutions to micronutrient deficiencies, which affect far more people than hunger alone, and this is crucial in most sub – Saharan African countries [7].
The intensity of color and its shade and hence the attractiveness of the raw material depends on the chlorophyll pigments and their proportions [8]. In green plants, the chlorophyll pigments are accompanied by carotenoids which affect the color of the raw material and of the products obtained from it and also enhance the vitamin content (mainly beta – carotene) [9]. Like Vitamin C and poly phenol compounds, caroteniods are also classified among the basic compounds with anti-oxidant effect [10], [11]. Green vegetables, including P. mildbraedii leaves are rich sources of antioxidants [12].
The objective of this study is to determine the carotenoids profile of P. mildbraedii using HPLC. In rural populations of developing countries, vegetables are stored at room temperature, especially when the market for freshly harvested produce is not enough or available. Also vegetables are often cooked prior to consumption in Africa. Therefore another aim of this study is to evaluate quality and nutrient retention after storage and cooking. The results of this research will determine the contribution of P. mildbraedii in the alleviation of micronutrient deficiencies among the impoverished rural populations in Nigeria. This will help to adequately establish its importance in human nutrition and provide basis for improved utilization of the crop.
2. Materials and Methods
2.1. Selection of Vegetable Sample
Pterocarpus mildbraedii, a green leafy vegetable commonly consumed by both rural and urban communities in South – eastern Nigeria was identified and used for research work.
2.2. Collection of Sample
Pterocarpus mildbraedii leaves were harvested from two farms (Amansea town in Anambra State and Udi in Enugu State) in December 2011. It was selected at random from the plant area and picked by hand mid – morning during the harmattan season. A minimum of 1kg of the crop was collected randomly from different plants within the field. The leaves were placed in black polyethylene bags and transported to the Biochemistry department of the University of Nigeria Nsukka for processing same day.
2.3. Processing of Samples
In the laboratory, the edible and inedible portions of the sample were separated. The inedible portions were discarded; the edible portions were washed with tap water and divided into three equal sub – samples. The first sub – sample was cooked for 5mins in boiling water with the lid on, the second sub – sample was wrapped in a newspaper and stored in the dark for 5 days at room temperature, while the third sub sample was used fresh.
2.4. Sample Preparation for Carotenoid Analysis
Both the raw, cooked and stored samples were oven dried in glass trays at 50°C for about 48 hours until there was no further moisture loss. The dried leaves were milled and sieved through 1 mm stainless steel sieve to obtain a homogenized sample. Approximately 30g of each of the sieved powdered sample was stored in sealed polyethylene bags and coded. The samples were stored at - 20°C until they were used for carotenoid analysis.
2.5. Sample Preparation for Analysis of Chlorophylls
The leaves were analyzed raw, cooked and stored without the drying, milling and sieving stages as earlier described. Raw and cooked leaf samples were analyzed same day, while stored leaves were analyzed five days later.
2.6. Analysis of Vitamins
Vitamin analysis was also carried out on raw, cooked and stored leaves. Ascorbic acid, riboflavin, thiamin, vitamin K and Niacin were analyzed. Samples were refrigerated before analysis.
2.7. Analysis of Mineral Elements
Potassium, calcium, magnesium, zinc and iron were analyzed. Raw, cooked and stored samples for minerals analysis were wet digested before analysis.
2.8. HPLC Determination of Total β – Carotene Content
The method of Howe and Tanumihardjo [13] was used. The extraction of carotenoid from dried, milled leaf samples 90.6g) was carried out using ethanol (6ml) containing 0.1% BHT, mixing by Vortex, and placing in a reciprocal shaking water bath (Model 25, Precision Scientific, 373 Model 25, 60647 – 4793) at 85°C for 5mins. Potassium hydroxide (500µl, 80%w/v) was added to the mixture to saponify the interfering oil and chlorophyll. Samples were vortexed and placed in a water bath (85°C) for 5mins, vortexed again and returned to the water – bath for additional 5mins. Upon removal, they were immediately placed in an ice bath (Model AF 200PSC 50R, serial no A 9601 BF 0981) where 3ml of cold de-ionized water was added. Carotenoids were separated 3 times with addition of 3ml hexane, vortexed and centrifuged (1200g) for 5mins. The combined hexane fractions were washed with de-ionized water 3 times, vortexed and centrifuged for 5mins at 1200g. The hexane fractions were dried in a vacuum rotary evaporator.
Samples were reconstituted in methanol/dichloromethane (1ml, 50:50 v/v) and 100µl were injected into the HPLC. A waters HPLC system (Water Corporation, Milfored, MA) consisting of a Guard – column, C30 YMC Carotenoid column (4.6 x 250mm, 3µ) water 626 binary HPLC pump, 717 Auto sampler and a 2996 photodiode array detector was used for carotenoids quantification. Solvent A consisted of methanol/water (92:8v/v) with 10mm ammonium acetate. Solvent B consisted of 100% methyl tert – butyl ether. Gradient elution was performed at 1ml/min with the following conditions: 29min linear gradient from 83% to 59% A, 6min linear gradient from 59% to 30% A, 1min hold at 30% A, 4min linear gradient from 30% to 83%a, and a 4min hold at 83% A.
Chromatograms were generated at 450nm. Identification of lutein, β – Cryptoxathin, and β – carotene were carried out using standards and with verification of absorption spectrum. Standard curves for lutein, β – cryptoxanthin and β – carotene standards are already established in the Crop Utilization Laboratory of the International Institute of Tropical Agriculture (IITA) Ibadan, Nigeria.
2.9. Spectophotometric Determination of Total Carotene Content
Determination of total carotene content of the leaf samples was according to the method of [14]. About 0.2 – 0.3g of the homogenous and representative sample was weighed into a mortar and a small amount (0.5g) of sea sand – 50 + 70 mesh was added to it. Pestle was used to grind the mixture with 20ml of cold acetone to extract the carotenoids. The resulting solution was filtered under suction through a Buchner funnel with small amounts of acetone, and the washings were received in the suction flask through the funnel. Thereafter, the residue was returned to the mortar fresh, cold acetone was added and the sample was macerated again. The resulting solution was filtered and washed as before.
The acetone extract was further partitioned in petroleum ether. Five milliliters (5ml) of distilled water, followed by 10ml of petroleum ether was put into a 250ml separating funnel. After that, the acetone extract was transferred into the separating funnel in batches. Also distilled water (about 500ml) was slowly added by allowing it to flow through the walls of the funnel to prevent the formation of emulsion. The washing was completed with 250ml brine solution to break any emulsion formed. During the last washing, care was taken to discard the lower phase as completely as possible without interfering with the upper phase.
Furthermore, chromatographic separation of the petroleum ether (P.E) carotenoid solution was also carried out. The column was prepared by putting some quantity of neutral alumina (of activity II) (about 5g). After that, the side of the column was tapped several times to better accommodate the adsorbent in the column. Also the column was topped with 0.5cm layer of anhydrous sodium sulphate. An aliquot of the P.E carotenoid solution was added to the column with a dropper. Thereafter, the column was eluted with petroleum ether. Also, the separating funnel was rinsed with about 5ml of P.E and the rinsing was added to the column. Addition of P. E. was continued after which the first fraction was collected into 25ml volumetric flask. The absorbance was later read at 450nm with (252W UV – Vis Grating Spectrophotometer, Gulfex Medical Scientific, England).
Total carotene content. (µg/g)= 
Where:
Afri= Absorbance at 450nm
Volume (ml) = volume of fraction 1
A 1%1cm = 2592 (absorption coefficient of β – carotene in petroleum ether (P.E)
2.10. Determination of Chlorophylls a, b, and Total Chlorophyll
Chlorophylls a, b, and total chlorophyll content of the leaf samples were determined according to the method of AOAC [15]. Two grams (2g) of each leaf samples was macerated with 0.1g CaCO3 and extracted repeatedly with 20ml of 85% acetone until the pigment was completely extracted. The extract was made up to 100ml with 85% acetone. Twenty five milliliter (25ml) of ether and 25ml of water were added to the filtrate and shaken vigorously in a separating funnel. The lower layer was discarded and another 50ml was added and shaken.
The mixture was allowed to settle and lower layer discarded. Ten milliliter (10ml) of the upper layer 10ml of water until all the acetone was removed. The ether was transferred and made up to 10ml with ether. A teaspoonful of anhydrous Na2So4 was added to remove residual water and the absorbance taken (UNICO II00R Spectrophotometer, USA) at 663nm and 645nm against ether as the blank, the concentrations of the chlorophylls were calculated from the following equations.
Total chlorophyll (mg/g) = 
Chlorophyll a (mg/g) = 
Chlorophyll b (mg/g) = 
Where V1= Volume in ml
W = weight sample
 = The length of light path in the cell (usually 1cm)
2.11. Determination of Vitamins
The vitamin content of Pterocarpus mildbraeddi leaf was determined by standard methods described by AOAC [15], Paul and Pearson [16].
2.12. Determination of Minerals
About 0.5g of each of the leaf samples was weighed into kjeldhal flask. Twenty five (25ml) of a mixture of concentrated hydrochloric and Nitric acid at the ratio of (3:1) v/v was added to the flask. The flask and its content were heated until the colour of the mixture cleared. The colorless liquid was then transferred to a 250ml volumetric flask and was made up to the mark with distilled water. This solution was evaluated for its content of Potassium, Calcium, Magnesium, Zinc and Iron. Atomic Absorption spectrophotometer (AAS) (Buck scientific 210VGP) was used for the detection of the minerals.
2.13. Statistical Analysis
The means, standard deviations and analysis of variance (ANOVA) of all the data obtained from the study were computed using the statistical Package for Social Science (SPSS) version 17. Analysis of Variance was specifically performed to detect significant differences (P < 0.05) among the sample means followed by the application of least significant Difference test (LSD) for the separation of significant means.
2.14. Experimental Design
The experimental Design was randomized complete block design having vegetable type and processing treatment (3) as some of the variations. Each observation was repeated three times giving 3 x 3 (9) observations for each parameter tested.
3. Results and Discussion
3.1. Chromatographic Profiles of Carotenoids
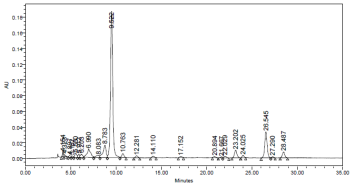
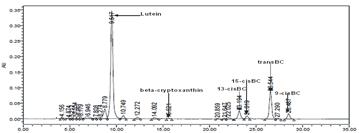
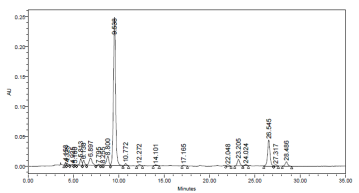
The chromatogram of the most common carotenoids pattern presented in investigated leafy vegetable is shown in fig 1. Two classes of carotenoids namely; xanthophylls and carotenes were identified and quantified under the HPLC conditions used for the research. Carotenoids were eluted in the following order: Lutein, β - cryptoxanthin, 13 – cis β – carotene, 15 –cis β – carotene, trans – β – carotene and 9 – cis - β - carotene.
3.2. Total β - Carotene Content
Table 1 Shows the carotenoids concentrations of Pterocarpus mildbreadii leaf as a result of effects of storage and cooking treatments. The total β – carotene (Tβ – c) level was significantly (p < 0.05) higher in cooked (212.44µg/gdwt) than in raw leaf (83.53µg/gdwt). This correlates with the results from Faber et al. [17]. Processed samples have greater extractability of carotenoids which could explain the higher Tβ – c levels in the cooked samples [18]. Cooking resulted in 254.32%, apparent retention when compared with the raw leaf (table 1). Dietz and Erdmaan [19] reported that cooking resulted in greater than 100% retention of β – carotene in vegetables, because denaturation of carotene binding proteins release the carotenoids so that they can be extracted more easily. Apparent retention was calculated according to Bergstrom [20]. Since our leaf samples were analyzed on dry weight basis.
Table 1 also show a statistical increase (P<0.05) in stored leaf Tβ – c content (100.65µg/gdwt) when compared with the raw leaf (83.53µg/gdwt). Tβ – c increase during the shelf – life period (5days) could result from continuation of physiochemical reactions (i.e. biochemical synthesis, metabolic interconversions and structure rearrangements [21]. However the observed increase in Tβ – c during storage resulted in an apparent retention of 120.49% (table 1). The import of this result was that the storage conditions in our study did not degrade the carotenoids. Comparing the Tβ – c content of Pterocarpus mildbreadii, with previous reports, Schonfeldt and Pretorius [21] recorded similar trend. They reported that Tβ – c content of cooked leaves can range from 61.53µg/gdwt, (Corchorus tridens) to 23.43µg/gdwt Amaranthus tricolor and of raw leaves from 36.63 µg/gdwt(Corchorus tridens) and 16.01 µg/gdwt (Amaranthus Tricolor). ZnidrCIC et al recorded 70.1 µg/gdwt and 79.6 µg/gdwt in wild rocket and Garden rocket respectively. It seems therefore, that the water leaf is a very rich dietary source of β – carotene
Though the % trans – β – carotene is high in cooked leaf sample when compared with that in raw leaf sample due to higher extractability, the levels of each cis –isomer 13 – cis -, 15 - cis - and 9 – cis- β – carotene) in cooked sample was higher than in corresponding raw and stored leaf samples. Thermal processing of foods results in trans/cis – isomerization [21]. A consistent trend in the ranking of the cis-isomers in the raw, cooked and stored samples 13-cis-> 9-cis- > 15 - cis- β –carotene was observed. Literature data suggest that the consequences of trans/cis- isomerization are changes in bioavailability and physiological activity [21]. However, only trans carotene is preferentially converted to retinol in the entorocyte [22]. Several different geometric isomers of carotene trans-, 9-cis, 13-cis-, and 15-cis isometric farms exist in food and human tissues [23][24][25]. The major carotene isomers in the circulation of humans is trans- carotene, with small amount of 13-cis- and 9-cis- carotene. However, circulating levels of the cis-isomers of β –carotene are not responsive to increased consumption of their isomers [22]. Besides, literature data suggest that each carotenoid shows an individual pattern of absorption, plasma transport and metabolism [22]. The levels of cis-isomers of carotene are much higher in leafy vegetables [26] [27]. Therefore, isomer separation is needed for the accurate determination of the vitamin A activity of leaf meals.
• Lutein increased on storage and doing cooking but the increase on storage was not significantly different (P < 0.05) from the raw sample. There was a significant decrease in β – crytoxanthin eluting storage.
Trans β – carotene constituted 60% of the total β – carotene content while 11 – cis; 9 – cis while 11 and 15 – cis constituted the rest. β – carotene retention was higher in cooked (254.32%) and stored vegetables (120.49%) when compared with the raw sample.
K content of cooked vegetable was significantly then the raw and stored samples. Ca, Mg, Zn and Fe followed the same trend. There was a slight decrease in these mineral elements on storage (except for mg) which was not statistically significant (p >0.05) from the values for raw samples.
3.3. Xanthophylls Content
The β – crytoxanthin content of the leaf was relatively in small quantity (table 1). β – crytoxanthin is a minor provitamin A constituent of leaves [18]. The β – crytoxanthin content of the cooked leaves (5.59µg/gdwt) was significantly (p>0.05) higher in stored leaves (4.88µg/gdwt) and non – statistically higher in raw leaf samples (5.05µg/gdwt).
Lutein content of the cooked leaf (507.97µg/gdwt) was significantly (p>0.05) higher than in both the raw (261.96µg/gdwt) and stored (343.33µg/gdwt) leaf samples (Table 1). Several previous reports on lutein contents of leaf vegetables had been recorded. Kopsell et al. [28] had showed that lutein concentration can range from 4.8 to 13.4mg/100gfwt for Kale and from 6.5 to 13.0mg/100gfwt for Spinach. A similar trend was reported by authors[28][29] who have shown values from 0.52 to 6.4mg/100gfwt for Kale and from 3.6 to 5.6mg/100gfwt for leaf beat and turnip greens and 11.0 ± 0.70mg/100gfwt Lutein in winterbor Kale [30]. Comparing the Lutein concentration in raw P. mildbraedii with the values reported, P. mildbraedii is therefore considered a rich source of dietary lutein. The presence of lutein and/or zeaxanthin in the diet may be beneficial for reducing the incidence of the two common eye diseases of ageing, age related macular degeneration and cataracts formation.
3.4. Provitamin a Content
The Provitamin A concentration in the leaf sample was calculated (Table 1) by adding the value of total β – carotene to one – half the value of the corresponding β – crytoxanthin [14]. The Principal Provitamin A carotenoids in leaves is β – carotene, while the β – crytoxanthin is a minor constituent [14]. The Provitamin A content of the raw, cooked and stored leaf sample are 86.05, 212 and 103.09µg/gdwt respectively. Vitamin A is expressed as β – carotene, retinol or retinal activity equivalent. Hence 1 retinol activity equivalent (RAE) = 1µg of retinol = 12µg of retinol of β – carotene = 24µg of other provitamin A (such as β – crytoxanthin) [20]. Using the conversion factors, the RAE/100g of the raw, cooked and stored leaf samples are 717.08, 1793.66 and 859.08 respectively. It follows that consumption of about 70g of the cooked P. mildbraedii leaves would meet the recommended daily allowance (RDAs) of 900RAE/day for men and 700RAE/day for women of 19 – 30 years old [20].
3.5. Total – Carotene Content
Post – harvest storage and cooking effects on total – carotene content of P. mildbraedii leaf was presented on table 2. The total - carotene content in cooked leaf (738.53µg/gdwt) was significant (p< 0.05) higher than in raw (429.70µg/gdwt) and stored (528.75µg/gdwt) leaf. This could be explained by higher extractability of carotenoids in cooked leaves. There was no statistical difference in total carotene content in raw leaf sample when compared with the stored leaf sample. This implies that the conditions under which the leaves were stored did not degrade the carotenoid.
However, there was numerical increase of total – carotenes in stored leaf samples when compared with raw leaf. Total – carotene value was higher than the corresponding total - β – carotene value. The differences were attributed to the assay method. The spectrophotometric method (AOAC) gives higher values for samples that contain a complex mixture of carotenoids, because the AOAC method measures total – carotene [1]. Granado et al [14] pointed out that the HPLC methods now available are more specific than other spectrophotometric assays.
Table 2. Effect of storage and processing methods on Total-carotene Content of Pterocarpus mildbraedii leafy vegetable.
| Total carotene content (g/g edible portion, dry weight basis) |
| LEAF SPECIES | TREATMENT | MEAN S.D |
| Pterocarpus mildbraedii | Raw | 429.70b±14.04 |
| Cooked | 738.53a±0.40 | |
| Stored | 528.75b±0.860 | (LSD= 6.25) |
Values are means ± standard deviations of duplicate determinations on dry weight basis.
Means with different superscripts within the same (Specie) column are significantly different (P≤ 0.05)
3.6. Chlorophyll Content
Chlorophyll a (ch a), chlorophyll b (ch b) and total chlorophyll (tchl) contents of Pterocarpus milldbraedii are 2.58; 1.34 and 1.72mg/g for raw, cooked and stored samples.. Initial contents of chl a. chl b and tchl in the raw leaf were 1.86, 0.72 and 2.58mg/g respectively. Chlorophyll degradation is accompanied by the loss of colour during processing and storage. Colour change during the selling period is very important because it affects produce attractiveness to consumers [22]. The loss of chl a, chl b and tchl after cooking the leaves for 5mins at 100°C were 54.83%, 27.77% and 48.06% respectively; While the loss at the end of storage period (5days) were 38.17%, 2083% and 33.33% respectively. The data showed that chl a degraded faster than chl b in all cases. These results were in accordance with previous experiments [22], [23], The ratio chl a/b (2.44) was similar to the values reported for other dark green leafy vegetables [23].
We can conclude that P. Mildbraedii Leaves had relatively high content of chlorophyll similar to that in Kale [22], Garden rocket [22] and exceeding that in Spinach [23].
3.7. Vitamins Content
The vitamin content of Pterocarpus Mildbraedii leaf is listed in table 4. Vitamin concentrations (in mg/100g) were 20.06, 0.46., 0.15 and 1.55 in ascorbic acid, riboflavin, thiamin and Niacin respectively. While vitamin K1concentration was 118.71µg/100g. Cooking decreased significantly (P>0.05) the contents of the water – soluble vitamins.
Water soluble vitamins leach into cooking water and some portion of it may actually be destroyed by heating [22]. However, cooking increased significantly (P>0.05) the content of vitamin K1 in the leaf. Vitamin K1 is located in chloroplasts in plants, cooking by boiling may disrupt the cell wall, thereby releasing vitamin K1 available for measurements [23]. The loss of ascorbic acid loss during blanching or cooking are enormous and may vary between 40 and 70% in some cooked vegetables when processed at 100°C for 10 min. [22]. Cooking is often responsible for the greatest loss of vitamin C and the effect of the loss depends upon variations in cooking methods and periods [22]. Also at the end of postharvest storage, the contents of the vitamins decreased significantly (P>0.05). Vitamin C degradation is due to auto – oxidation and also enzymatic degradation. Consequently vitamin C losses continue through postharvest handling, processing, cooking, and storage of fruit and vegetables [23]. The loss in ascorbic acid after storage in this study was 32.15%. Other researchers have also reported postharvest losses in ascorbic acid. [23] The fact that losses of ascorbic acid (A.A) from vegetables are large during blanching occurs primarily by leaching rather than by chemical degradation [1] [26]. A. A is easily oxidized, so it will gradually decrease during storage.
Initial contents of some of the vitamins were in agreement with previous reports. [26] 3.45mg/100g niacin, 0.14mg/100g thiamin and 19.6mg/100g ascorbic acid in P mildbraedii. However, lower values of some of these vitamins were reported for various dark green leafy vegetables by Uusiku et al. [22]. Variations in nutrient content in processed vegetables; its Concentrations can vary depending on vegetable type, maturity at harvest, genetic variations, preharvest conditions, postharvest handling, storage conditions, processing and preparation [23], It is therefore evident that concentrations of ascorbic acid, riboflavin and vitamin K1 in P. mildbraedii are high and adequate to meet the RDAs of 90mg/day ascorbic acid, 1.3mg/day riboflavin and 90µg/day vitamin K1 in children and adults respectively [23]. P. mildbraedii leaves is therefore crucial in micronutrient malnutrition (MNM) intervention in most developing countries of Sub – Sahara Africa.
3.8. Mineral Content
The effects of storage and processing on the selected mineral contents of pterocarpus mildbraedii are presented on table 5. The mineral contents of the raw leaf were (in mg/100g) potassium 5.05, calcium 0.85, magnesium 2.50, zinc 1.95 and iron 2.50 respectively. Cooking of the leaves for 5mins at 100°C significantly (P >0.05) decreased the levels of the elements. [27] observed significant (P>0.05) reductions in K, Na, Ca and Fe contents of cooked tender and matured cassava leaves. During the cooking process, these minerals leached into cooking water Souzan et al. [30]. The potassium, calcium and iron value in p. midlbraedii correlated well with other findings. Sobowale et al. [29]. However, higher values for calcium and potassium were reported by Luciane et al. [27] in watercress Kale and cabbage and in the review of Uusiku et al. [22] in Amaranths Sp and Solanum nigrum leaves respectively. This variability was expected since the Fresh Green Leafy Vegetable (FGLV) belonged to different locations, where the soil and climatic conditions including light and temperature are dissimilar [25]. The addition of fertilizers, the age of tissue chemical composition of the medium in which the food was grown are also important [25].
Post – harvest storage conditions in our study resulted in a non – significant reductions in the mineral contents when compared with the raw leaves. The reductions could be due to effects of oxidizing agents, exposure to heat, light and extremes of pH and other factors that affect organic nutrients. [28][29][30][31][32].
The results for mineral analysis of P. mildbraedii leaves suggest the consumption of large quantities to meet the recommended daily allowance (RDAs) for minerals.
4. Conclusion
The potential of locally consumed leaf vegetable, P. mildbraedii in alleviating micronutrient deficiencies, especially vitamin A deficiency was evaluated. The results showed that the consumption of about 50g per pay of cooked P. mildbraedii leaf would meet the required daily allowance (RDA) of vitamin A in children and adults. Also the result indicated that consumption of about 100g P. mildbraedii leaf per day would meet the RDAs of riboflavin, ascorbic acid and vitamin K1 in children and adults respectively.
Storage and cooking of the leaves after harvest resulted in several changes in quality and nutritional parameters. There were significant changes in carotenoids, chlorophylls, vitamins and minerals during cooking and significant changes in ascorbic acid during storage and cooking of the leaves. Therefore the data generated on the composition of carotenoids, chlorophylls, vitamins and minerals in this leafy vegetable could be the basis for suggesting the inclusion of this leaf in a daily diet to overcome health problems such as vitamin A deficiency, iron deficiency (anaemia) and age – related macular degeneration.
References
- Burkill IH. The Useful Plants of West Tropical Africa (Vol. 3Families J-L). Royal Botanical Garden, Kew, 1995, 605.
- Okafor JC. Improving edible species of forest products. Unasylva 1991, 165 (42): 17-23.
- Dennison BA, Rockwell, HL, and Baker SL.. Fruit and Vegetables intake in youngchildren J. Amer. Coll. Nutr 1998, 17: 37–378.
- Block G, Patterson B, and Subar A. Fruits, Vegetables and cancer Prevention, a review of the epidemiological evidence. Nutr. Cancer 1992, 18: 1–29.
- Ruel MT, Minot, N, Smith N, Smith L.. Patterns and determinants of fruits and vegetables consumption in Sub – Sahara Africa. A multicountry comparison. Background paper for the Joint FAO/WHO workshop on fruit and vegetable for health. 2005 September 1–32004.
- Kobe, Japan, WHO, Geneva, Switzerland.
- IPGRI. International plant Genetic Resources Institute. Conserving and increasing the use of Neglected and underutilized crop species. Retrieved October 15, 2005 from http:www.ipgri.cigar.org/institute/siteinfo.html.
- Lisiewska Z, Stupski J, and Kuros A. Influence of cultivation period, cultivar and useable part on content of chlorophyll and volatile oils in dill (Anethun graveolens L.) 2001Electronic Journal of Polish Agricultural Universities Food Science and technology.http://www.cjpali.media.pl/series volume4/issue2/food/art - 18html.
- Bhaskararchary K, Sankar RDS, Deosthale YG, and Vinodini R. Carotene content of some common and less familiar foods of plant origin. Food Chemistry 1995, 54: 189–193.
- Kidmose U, Knuthsen, P, Edelenbos, M, Justesen, U, and Hegelund, E. Carotenoids and flavonoids in organically grown spinach (Spinacia oleracea L.) genotypes after deep frozen storage. Journal of the Science of Food and Agriculture 2001, 81: 918–923.
- Agte VV, Tarwadi, KV, Mengale S, Chiplonkar, SA. Potential of traditionally cooked green leafy vegetables as natural sources for supplementation of eight micronutrients in vegetarian diets. Journal of Food Composition and Analysis, 2000, 13: 885–891.
- Howe JA, and Tanumihardjo SA. Evaluation of Analyticcal Methods for Carotenoid Extraction from Biofortified Maize (Zea mays sp.). Journal of Agricultural Food Chemistry 2006, 54: (21) 7992-7797.
- Rodriguez-Amaya DB, Kimura M. Harvest plus hard book for carotenoid analysis ( HarvestPlus Technical Monograph 2.). Washington: HarvestPlus. 2004.
- AOAC. Official Methods of Analysis of AOAC (Association of Official Analytical Chemists) International (18th edn). AOAC 2005, International, Gaittheersburg, MD.
- Paul G, and Pearson S, The vitamin 2nd edn, Academic Press, New York, USA, 2005, 31-34.
- Faber M, Oelofse A, Van—Jaarsveld PJ, Wenhold FAM, Jansen RWS. African leafy vegetables consumed by households in the Limpopo and KwaZulu-Natal Provinces in South Africa. South Afr. J. Clin. Nutr 2010, 23:1.
- Rodriguez-Amaya DB. Carotenoids and food preparation: The retention of provitamin A carotenoids in prepared, processed, and stored food. 1997, USAID. OMNI Project.
- Dietz JM, Kantha SS, and Erdman JW. Reversed phase HPLC analysis of a- and b-carotene from selected raw and cooked vegetables. Plant Foods for Human Nutrition 1988, 38: 333–341.
- Bergstrom L. Eurofoods-Enfant NLG project. Livsmedelverket; Uppsala. Nutrient losses and gains in the preparation of foods 1994.
- ŽnidarČiČ Dragan, Dean Ban and Helena S (2011). Carotenoid and chlorophyll composition of commonly consumed leafy vegetables in Mediterranean countries. Food Chemistry 129:1164-1168.
- Uusiku, N. P., Oelofse, A., Duodu, K. G., Bester M. J., and Faber, M., (2010). Nutritional value of leafy vegetables of sub-Sahara Africa and their potential contribution to human health. A review. Journal of Food Composition and Analysis 23: 499–509.
- Kopsell, D. A., Kopsell, D. E., Curran-celentano, J., and Wenzed, A. J., (2009). Genetic Variability for Lutein concentrations in leafy vegetables crops can influence serum carotenoid levels and macular pigment optical density in human subjects. Acta Horticulturations., 841: 113–117.
- Granado, F., Olmedulla, B., Blanco, I., Gil-Martinez, E., and Rojas-Hidalgo, E. 1997. Variability in the inter comparison of food carotenoid content data; a user’s point of view, Crit.Rev. Food Sci. Nutr. 37:621–633.
- Lisiewska, Z., Stupski, J. and Kuros, A. 2001. Influence of cultivation period, cultivar and useable part on content of chlorophyll and volatile oils in dill (Anethun graveolens L.) Electronic Journal of Polish Agricultural Universities Food Science and technology. http://www.cjpali.media.pl/series /volume4/issue2/food/art - 18html.
- Negi P. S., & Roy S. K., (2000). Effect of blanching and drying methods on β-carotene, ascorbic acid and chlorophyll retention of leafy vegetables Lebensm Wissensch. Techno 33: 293–298.
- Luciane, M, Kawashima, lucia, M and Valente soares (2003). Mineral profile of raw and cooked leafy vegetables consumed in Southern Brazil. J Food Comp Anal. 16:60 5-611.
- Jaworska, G. & Kmiecik, W. (1999). Effect of the date of harvest on the selected traits of the chemical composition of Spinach Spinacia olearceae) and New Zealand Spinach (Tetragonia expansa Murr). Acta Agraria et Silvestria 26.
- Sobowale, S. S., Olatidoye, O. P., Olorodo, O. O., and Sokeye O. K., (2010). Effect of preservation methods and storage on Nutritional quality and sensory properties of leafy vegetables consumed in Nigeria. Journal of Medical and Applied Biosciences 2: 46–56.
- Souzan, S. L., & ABD EL-AAl (2007) Mineral profile – Shelf Life Extension and Nutritive value of Fresh Green Leafy Vegetables consumed in Egypt. African Crop Science Conference Proceedings. 8: 1817–1826.
- Usuwazo, A. B. and Tanulo, B., (2006). The Vitamins. J. Food Sci., 23: 54–57.
- Okpalanma, F., P.C. Ojimelukwe and E.A Mazi.2013 Post harvest storage and processing changes in carotenoids and micronutrients in fluted pumpkin (Telferia occidentalis Hook. F.) Journal of Agric and Vet Med 6 (4) 34-39
- Ramesh, K.S., Shivraj, H.N. Se Won Park. 2015. Carotenoids from fruits and vegetables; chemistry, analysis, occurrence, bioavailability and biological activities. Food Research International76:735-750.