Strength Calculations on Damage in Whole Process to Elastic-Plastic Materials---The Genetic Elements and Clone Technology in Mechanics and Engineering Fields
Yangui Yu1, 2
1Principal Office, Zhejiang Guangxin New Technology Application Academy of Electromechanical and Chemical Engineering, Hangzhou, China
2Wenzhou University, Wenzhou, China
Email address
Citation
Yangui Yu. Strength Calculations on Damage in Whole Process to Elastic-Plastic Materials---The Genetic Elements and Clone Technology in Mechanics and Engineering Fields. American Journal of Science and Technology. Vol. 3, No. 5, 2016, pp. 140-151.
Abstract
The author bases on the principles of similar to the genetic genes in the life sciences, uses the theoretical approach, adopts the conventional material constants, discovers some new constants for some materials of Masing’s and elastic-plastic ones which show inherent properties from micro to macro damage; and sets up new computing models to the damage strength in different stages; proposes the calculating criterions which are defined as the damage value and the damage factor; and provides two kinds of the assessment methods for them in whole process. In addition, to supplement the comprehensive figure of the material behaviours; to give yet a detailed calculating example for a safety assessment. This works may be there are practical significances for the decreasing experiments and for make linking and communication among the modern material subject, fracture mechanics and the damage mechanics.
Keywords
Elastic-plastic Materials, Strain Harding, Strength Criterion of Damage, Assessment Method of Damade Value, Assessment in Whole Process
1. Introduction
It is well known that for the traditional materials mechanics, which is a calculable subject and has made valuable contributions for every industrial engineering designs and calculations; but it cannot explain sudden fracture accidents on some structures for which working stresses are less than the original design permitting ones. In that the materials mechanics is only considered for those materials and the structures as the continuous and homogeneous medium to research and calculate, so that in their calculating models mainly there are the stresses and the strains and the relating material constants. Therefore, it can be generally only represented and calculated for those relations between the stresses and the strains about the strength problems. In practice in engineering materials and structures, usually there are various micro- or macro-flows (cracks), so it cannot solve and calculate once existed cracks. But in the fracture mechanics and the damage mechanics, which are just based on the local problems as researched objects for the local defects inside materials, to research the driving forces, the crack propagating (damage) rates and the life predictions in the crack growth process; in their calculating models to contain such calculable parameters as the crack size or as the damage variable
  . Consequently, these subjects can just solve and calculate problems mentioned above. But, nowadays, these latter disciplines are all mainly dependent on tests, and due to the micro-crack and the macro-crack behaviors there are obviously differences, who want to establish their calculating models about the strength, the crack propagation rate and the life predictions of the whole process from the micro-crack to macro-crack growth, which are more difficult and more complicated problems. To pay the manpower and money for experiments are more huge.
The author thinks that in the mechanics and the engineering fields there exists such a scientific law as similar to genetic elements and cloning technology in the life sciences and has used the theoretical approach for similar principles, proposed some calculation models [1-10], recently sequentially discovered some new scientific laws to the Masing’s and the elastic-plastic materials, and provides some new calculable models for the crack growth driving force, the calculating criterions and the assessment methods of the strength problems on the damage in the whole process which are from midro to macro damage. This is to try to make the modern fatigue, the damage mechanics and the fracture mechanics gradually become such calculable disciplines as the traditional materials mechanics. That way, it may be there are practical significances for decreasing experiments to stint manpower and funds for promoting and developing engineering and applying it to relevant disciplines.
2. A New Comprehensive Figure on Materials Behaviours
About problems among branch disciplines on fatigue-damage-fracture; about problems among the traditional material mechanics and the modern mechanics for communications and connecting their relations with each other, we must study and find out their correlations between the equations, even the relations between variables, between the material constants, and between the curves. This is because all the significant factors are to be researched and described for materials behaviours at each stage even in the whole process and are also all to have a lot of significations for the engineering calculations and designs. Therefore, we should research and find an effective tool used for analyzing the problems above mentioned. Here, the author provides the "Comprehensive figure of materials behaviors" as Figure 1 (or the bidirectional combined coordinate system and simplified schematic curves in the whole process, or combined cross figure) [10] that both is a principle figure of materials behaviors under monotonous loading, and is one under fatigue loading. It is also a comprehensive figure of multidisciplinary. Here in two problems to present as below:
2.1. Explanations on Their Geometrical and Physical Meanings for the Compositions of Coordinate System
In figure 1, it was being provided by the present author; at this time it has been corrected and complemented, that is, diagrammatically shown for the damage growth process or crack propagation process of materials behavior at each stage and in the whole course.
For the coordinate system, it is to consist of six abscissa axes  I",
I",  I’,
I’,  I,
I,  Ⅱ,
Ⅱ,  Ⅲ,
Ⅲ,  IV and a bidirectional ordinate axis
  . For the area between the axes I" and I, it was an area applied as by the traditional material mechanics. Currently, it can also be applied for the micro-damage area by the very high cycle fatigue. Between the axes I’ and Ⅱ, it is calculating area applied for the micro-damage mechanics and the micro-fracture mechanics. For the areas among the Ⅱ, the Ⅲ and IV where they are calculatied and applied by the macro-damage mechanics and the macro-fracture mechanic. But for between the axes I and Ⅱ, it is calculated and applied in areas both for the micro-damage mechanics and for the macro-damage mechanics, or both for the micro-fracture mechanics and for the macro-fracture mechanics.
On the abscissa axes I" and I, they are represented with parameters the stress  and the strain
  as variables. On the abscissa axes I’ there are the fatigue limit
  at point "a"
  and "b"
  that they just are the locations placed at threshold values for crack (damage) growth to some materials; on the abscissa axes I there are points "A" and "D" that just are the locations placed at threshold values to another materials. On the abscissa axes I and Ⅱ that they could all represented as variables with the stress intensity factor range
  of short crack, and the strain intensity factor
  , and the stress intensity factor range
  of long crack. On the other hand, they both are yet represented as variables with the short crack
  and the long crack
  (or damage
  and
and  ). And here there are materal constants of two that they are defined as the critical factor
  of crack-stress-intensity and the critical factor
  of the damage-stress-intensity at the first stage, where that are just the transition parameters corresponded to the critical crack size
  or the critical value of damage
 , they are just placed at point at the point B and at point
  corresponded to yield stress, that are also the boundary between short crack and long crack growth behaviors; but for some brittle materials would be happened to fracture to this point when their stresses are loaded to this level.
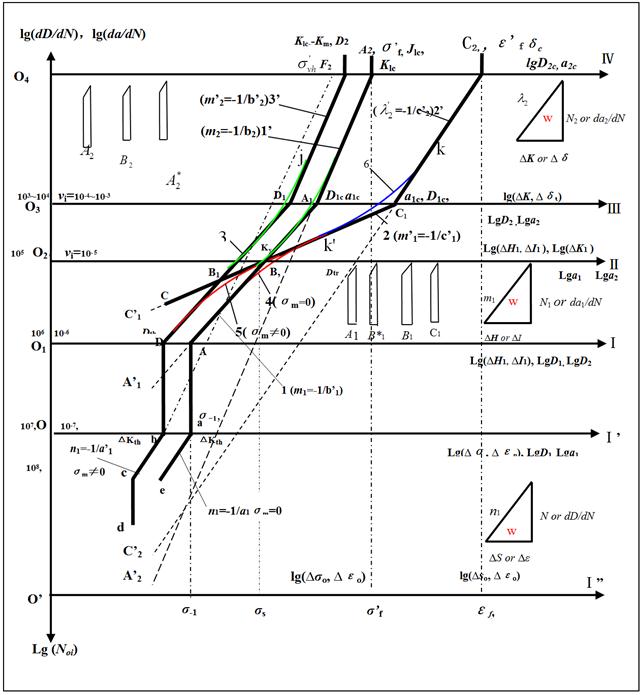
Figure 1. Comprehensive figure of material behaviors (Or called calculating figure of material behaviors or bidirectional combined coordinate system and simplified schematic curves in the whole process).
On the abscissa axes O3 Ⅲ, it is represented as variable with the stress intensity factor (or  ) of long crack; it is a boundary between the first stage and the second stage for some elastic-plastic materials. On this axes O3 Ⅲ there are the critical points at D1, A1, and C1 (D1c, A1c). On abscissa IV, the point
  is corresponding to the fatigue strength coefficient
  , the critical stress intensity factor values
  and the critical values
  and
and  for the mean stress
  ; the point is corresponding to the
  ; the point
  corresponding to the fatigue ductility coefficient
  and critical crack tip open displacement value
  ; the point
  corresponding to a very high cycle fatigue strength coefficient
  . In addition on the same IV, there are yet another critical values
  , etc. in the long crack propagation process.
For an ordinate axis, an upward direction along the ordinate axis is represented as crack growth rate  or damage growth rate
  in each stage and the whole process. But a downward direction is represented as life
  in each stage and the whole lifetime
  .
.
In the area between axes I" and Ⅱ, it is the fatigue history from un-crack to micro-crack initiation. In the area between axes I’ and Ⅱ, it is the fatigue history relative to life  from micro-crack growth to macro-crack forming. Consequently, the distance
  on ordinate axis is as the history relating to life
  from grains size to micro-crack initiation until macro-crack forming; the distance -
 is as the history relating to the lifetime life
  from micro-crack initiation until fracture.
In the crack forming stage, the partial coordinate system made up of the upward and the ordinate axes and the abscissa axes I’,I and Ⅱ is represented as the relationship between the crack growth rate  (or the short crack growth rate
  ) and the crack-stressfactor range (or the damage strain factor range
  ). In the macro-crack growth stage, the partial coordinate system made up with the ordinate axis and abscissa Ⅱ, Ⅲ and IV at the same direction is represented to be the relationship between the macro-crack growth rate and the stress intensity factor range
  ,
,  -integral range
  and crack tip displacement range (
 -, and ). Inversely, the coordinate systems made up of the downward ordinate axis and the abscissa axes IV, Ⅲ, Ⅱ, I, and I’ are represented respectively as the relationship between the
  -, - range and each stage life and the lifetime (or between the
  -, - range and the life ).
2.2. Explanations on the Physical and Geometrical Meanings of Relevant Curves
The curve  is represented as the varying laws as the behaviours of the elastic materials or some elastic-plastic ones under high cycle loading in the macro-crack-forming stage (the first stage): positive direction represented as the relations between (or )-; inverted
  , between the
  . The curve
  is represented as the varying laws of the behaviours of the elastic-plastic materials or some plastic ones under low-cycle loading at the macro-crack forming stage: positive direction is represented as the relations between -; inverted
  , the relations between the
  .
.
The curve  in the crack growth stage (the second stage) is showed as under high cycle loading: positive direction showed as - (); inverted
  , between the
  ,
,  . The
. The  is showed as: the positive, relation between the - under low-cycle loading, inverted
  , between ()-
 . By the way, the curves
  and the
  () are represented as the laws under the very high cycle fatigue.
It should yet point that the curve  (1-1’) is depicted as the rate curve of damage (crack) growth in whole process under symmetrical and high cycle loading (i.e. zero mean stress,
  ); the curve
  (3-3’), as the rate curve under unsymmetrical cycle loading (i.e. non-zero mean stress,
  ). The curve
  (2-2’) is depicted as the rate curve under low cycle loading. The curve
  is depicted as the damage (crack) growth rate curve in whole process under very high cycle loading (
 ), the curves
  and
and  are depicted as ones of the damage (crack) growth rates in whole process under very high cycle loading (
 ). Inversely, the curve
  is depicted as the lifetime curve under symmetrical cycle loading (i.e. zero mean stress,
  ), the curve
  , as the lifetime curve under unsymmetrical cycle loading
  . The curve
  is depicted as the lifetime curve under low cycle loading
  . On the other hand, the curve
  is as the lifetime one in whole process included very high cycle fatigue (
 ), the curves
  and
and  are all depicted as the lifetime ones in whole process
  .
.
It should also be explained that the comprehensive figure 1 of the materials behaviours may be a complement as a fundamental research; that is a tool to design and calculate for different structures and materials under different loading conditions, and it is also a bridge to communicate and link the traditional material mechanics and the modern mechanics.
3. Strengh Calculations on Damage Under Monotonic Loading
Here the damage variables D for describing the damage growth process that are defined as follows:
1) From micro-crack initiation to macro-crack forming process, it is defined in the crack forming stage or defined in the first stage. If applying the concept of the damage mechanics, it is defined in the micro-damage stage, and it adopted variable D1 called as the micro-damage variable, corresponded to the variable a1 of a short crack that it is corresponding curve AA1 in figure 1;
2) From the macro-crack propagation to the fracture process is defined in the crack growth stage, or defined in the second stage, and here it is also applying the concept of the damage mechanics, it is defined in the macro-damage stage. The damage variable D2 of this stage is called in the macro damage variable, corresponds to the variable a2 of the long crack that it is corresponding curve A1 A2 in figure 1;
3) From micro-damages to full failure of a material, to adopt the parameter D as the variable in the whole process, it corresponds to the crack variable a in the whole process from short crack to long crack growth until full fracture that it is corresponding curve AA1 A2 in figure 1.
3.1. About Threshold Value on Damage
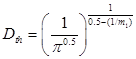
Under the monotonous loading, the behabirous of damage for a material, it is changed with the loading ways and the stress levels, its damage value shown before the yield stress  can be caculated by following formula,
 , (1)
, (1)
Where the  is a stress value of proportional limit (approximating elastic limit, it can also approximatively be took for definite ratio by the yield stress, for example
  , if the data is to lack. The
  is only a shown the constant of a property, it is same with the
  also a sole one
  . Here it should explain that the operative symbol of the constant b1 is a negative value; and the m1 is a positive one.
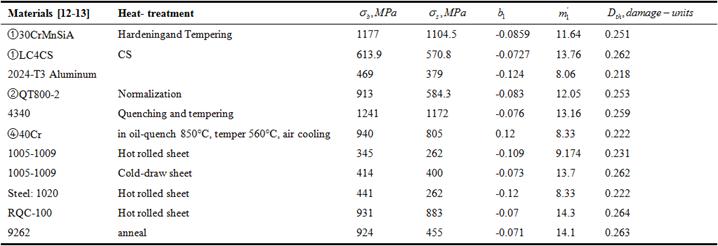
In the figure 1 it is seen, for the general steels, they are always shown with various characters in the each stages. The author discovers they all have the threshold values  of the damage in table 1, and only depended on the exponent .
It should point the location of the threshold value of damage is at the point A where it is at the intersection one between the straight line AA1 and the abscissa axis  I in figure 1. And the threshld can be calculable one with as following formula, it should be

 (2)
(2)
Or
 (3)
(3)
The range of the in equation (2-3) is in 0.21~0.275 (damage-units), it is equivalent to in length 0.21~0.275 (mm) of short crack [11].
At the stage happened elastic behaviour for elastic-materials, when the damage value is combined by the with the stress induced under the monotonic loading, so that to form a model of the driving force that is as below,
 (4)
(4)
In the above formula, ; the  is defined as the stress intensity factor of micro damage. Because the variable is a dimensionless value, it is equivalent to the length of short crack, here it must defined in "1mm-length of crack " equivalent to "1-unit-damage-value", in "1m-length of crack" equivalent to "1000-damage units". In an ordinary way, the
  may be: the
  or
or  , for the strength criterions of them are as below,
 (5)
(5)
Or
 (6)
(6)
Where the  is defined as the threshold factor of damage. It should point the location of the threshold is at the point A where it is at the intersection one between the straight line AA1 and the the abscissa axis O1I in figure 1. If to take the yield stress to replace the in the equaton (4), it is come as following form
 (7)
(7)
Then the  is defined as the threshold factor corresponded to the yield stress, so that the must be the only a constant showing a material property; And the damage of a material is sure to grow if the
  .
.
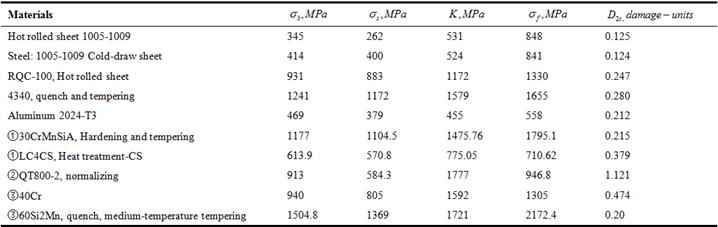
Table 1. Data of threshold values on damage.
3.2. Strength Calculation on Damage at the First Stage
The material property had discovered by Masing, that as is well known [14]. For some Masing’s, elastic-plastic and happened strain hardening materials, which are corresponded to the curve 1( ) in the first stage between abscissa axis O1 I and the O2 II in figure 1. If the stress inside a material is gradually loaded to the yield stress (at point B on abscissa axis O2 II) or over this level to the A1 (at point A1 on abscissa axis O3 III), then its damage will also increasingly grow, here can set up a criterion of the damage strength for it, that is as below form,
 (8)
(8)
 (9)
(9)
The  in (9) is defined as a critical value of the stress intensity factor on damage, the is a value corresponded to the critical value and the transition value Dtr of damage, also is the boundary between the short crack and the long crack. Their locations are at points B on abscissa axis O2-II (in Fig. 1). But for some cast iron, low strength steels and brittle materials which could be happened to fracture when their stresses are loaded to this level.
As is well know the mathematic model to describe a long crack in fracture mechanics, that is to adopt these "genes"  and
and  and crack variable
  , thereby to make the stress intensity factor
  [15-17]; Here can take the variable
  of macro damage in the name of macro damage mechanics to displace the crack size inside the
  , then it can still derive the equation of driving force for the describing behavior of macro damage, that is as following form,
 (10)
(10)
Where the  is a stress intensity factor of the macro damage, it is equivalent to
  , but their dimensions and units are differences at this same point. Here is sure to explain, the area between the abscissa axis O1-I and the O2-II in Fig. 1, where it is corresponded to the
  -values from the threshold
  to
to 
 , in the area it can set up two kinds of the mathematic models called the stress factors. In addition to above equations (8-9) can be applied; in theory below the mathematic models (10-14) are still suitable in the first stage.
For some Masing’s materials, their damage values  at transition points between the elastic and the plastic strain, it is also be calculable, and can be calculated by means of the following equation,

 (11)
(11)
Where  is a strength coefficient under monotonic loading, the
  is a exponent happened strain hardening. Then the model of driving force at this point should be as follow
 (12)
(12)
Where the  is defined as the stress factor of damage that is relevant to the damage value
  at transition point, just is corresponding to size
  of forming macro crack, it is the very at point B related yield stress
  on abscissa axis O2-II in fig. 1, also a the critical value in the first stage, where it is on boundary between the first stage and the second stage.
Here it need yet explain, this factor should theoretically be equivalent to above mentioned the in first stage, although the dimensions and units between them are differences. Therefore the strength criterion of its damage should be calculated as following form,
 (13)
(13)

 (14)
(14)
Where the  [18-19] is a correcting factor related with the shape and the size of a crack; the
  is a the critical value of damage corresponded to the
  mentioned above. It shoud point, because the yield stresses is the constant of uniquenesses for a material, the critical value of damage can also be applied as an important parameter showed its property. In practice, the critical value
  could be calculated by means of below formula:
 (15-1)
Here has to point the above equations, the data error in the calculations is bigger for those materials happened strain softening.
In the table 2, here are listed to the critical values of damage for 13 kinds of materials.
Table 2. The critical values  of damage.
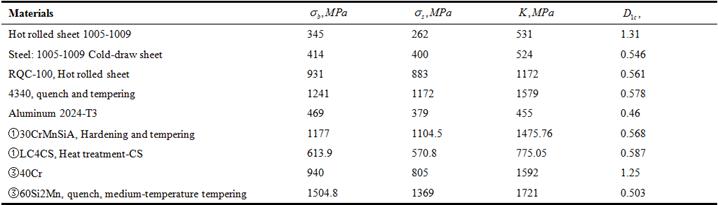
Note:  is a strength limit;
  is an yield limit;
①---The Masing’s materials; ③-Cyclic softening.
3.3. Strength Calculation on Damage at the Second Stage
When the damage growth gets to the macro damage stage where it is corresponding to the curve  in figure 1, for the behaviour of some materials corresponded curve
  between the abscissa axis OII and the O3III (or over the O3III), they form the critical values
  of macro damage are usually later than those brittle materials, their life are also longer, so the transition points between two stages in damage process are on the abscissa axis O3III that just is as the boundary of them. In this case that strength criterion (12-13) on damage in first stage can still be sutied for calculations in the second stage.
By the way, when a structure is being calculated in design, if the damage grows to the stage of macro damage, then the damage value  in the equation (12) can also be calculated for the predictions by following formula
 (15-2)
When the damage growth over the abscissa axis O3III to the O4IV in figure 1, the strength criterion of damage at later time in the second staege should be as following form [20-22],
 (16)
(16)
 (17)
(17)
Where the  is defined as the stress factor of damage in the second, the
  is a critical factor of damage that it is equivalent to the critical stress intensity factor
  in fracture mechanics. The
  is a fracture stress, the
  is a critical damage value where it is at the crossing point A2 of the abscissa axis O4-IV and the straight line 1
  in Fig. 1.
It should yet explain because the  is also a material constant, it must be the data of uniqueness to show a material performance, and it could be calculated out by mens of the fracture stress (in the table 2). So that the critical value of damage
  under corresponding to true stress should also be the only data. In theory, it must be to exist as following functional relationship,
 (18)
(18)
In the table 3 to include the critical values  of some materials.
Table 3. The critical values  of damage.
Note:  is a strength limit; is an yield limit;
①---The Masing’s materials; ②---The cycle-harden materials; ③-Cyclic softening materials.
3.4. Strength Calculations on Damage in Whole Process
Due to the behaviors shown by the materials are different at each stage, their dimensions and units in computing models about strength problem are also differences. But the author researches finding recently, on account of the critical values at each stage are all inherent constants, they are the only depended on the material properties, therefore here to exist necessary critical values of damage at each stage. So that the critical values of damage as the material constants in whole process have been proposed as following forms:
 (19)
(19)
Or
 (20)
(20)
It shoud point that the data in table 4 is the material constants for six kinds of materials, which they are under the monotonous loading. The data in table 5 is called as the critical value of damage which is calculated with calculable formulas.
Table 4. Data of material’s performances.
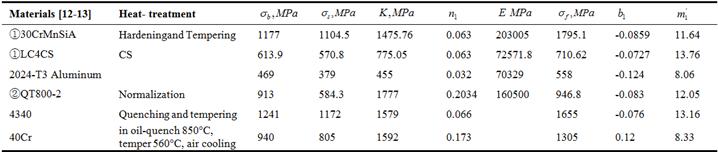
①---The Masing’s materials; ②---The strain harding material;
③---it is a material happened the strain softening under cyclic loading.
Table 5. Calculated data with calculable formulas.
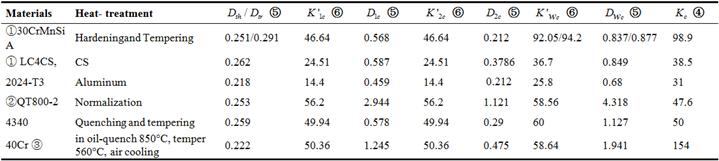
①---The Masing’s materials; ②---The cycle-hardening material;
③---it is a material happened the strain softening under cyclic loading; ④  is the experiment data of critical stress intensity factor,
  ;
;
⑤—Units are the "damage-units"; ⑥--- Units are the " ".
".
It can seen from the above table 5, for the critical factors  and the
  of damage,
  , because corresponding to point of the -value just is the one of the - value, where they are the same at point A2 on abscissa axis O4 IV; but for their critical values of damages,
  . So, when to take the value for the
  it must only be caculated by the
  or
or  with the safe factor
  .
.
Here can be compared in calculated data with the experiment ones  , and can be seen out: (1) the calculating value for the nodular cast iron QT800-2 which is materials happened strain harding, the
  of it close to the experimental data
  ; the for the steel 4340 by quenching and tempering is also close to the experimental ; the calculating values
  for Masing’s materials 30CrMnSiA and LC4CS, between the and the , both is approximating; the for the aluminum
2024-T3 is also close to the experimental . (2) But for the steel 40Cr of shown strain softening, both error between the calculated and the experimental data is bigger.
The calculating criterions about the damage strength in whole process there are two kinds of ways: 1) The assessment method of the damage factor; 2) The assessment method of the damage value. It should explain, if to apply the assessment method of the damage value, it must use the variables  and in whole process, and it has to adopt their critical values shown different performances which relevant material conatants
  and at each stage.
For instance, for a material, it can adopt the following ways:
1. The assessment method of the damage factor
(1) The condition 1
Calculating for the stress factor of micro damage is
If the 
Then the damage for the material will not grow.
If the  ,
,
The damage will be growth.
(2) The condition 2
Calculating for the stress intensity factor in the first stage is as below,
1)  ,
,
Here  ;
;
2)  ,
, ,
,
Here  ,
,
Here, for the materials of happened strain harding,  ; and for Masing materials,
  .
.
(3) Condition 3
Calculating for the stress intensity factor  macro damage in the second stage, that is as following formula,
1) 
The 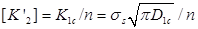
Here, for the materials of happened strain harding, ; and for Masing materials, .
2)  .
.
The  .
.
Here, for the materials of happened strain harding, ; and for Masing materials, .
For example, it can see the  of the QT800-2 and 4340 in the table 5.
(4) Condition 4
Calculating for the stress intensity factor  in the whole process, that is as following formula,
 (21)
(21)
Here the is fefined as the stress factor of damage in whole process, the  is a total value of damage, that can be calculated with following formulas,
 (22)
(22)
 (23)
(23)
For the materials of happened strain harding and Masing’s ones, that  is
is
 ,
,  .
.
For example, where it can see the  of the steels 30CrMnSiA and LC4CS in the table 5, total value
  of the critical damage can be calculated by following formulas, or ;
If it can be corresponded under all conditions mentioned above for a material, then, it is placed under a safe state in a definite time; Otherwise, that isn’t the safe.
2. The assessment method for the damage value
(1) The cases 1
If the damage values are as following cases
It may be: or
or  .
.
(2) The condition 2
1) The damage value in the first stage is as below,

Here, for Masing’s material,  ; for the materials of happened strain hardening, .
2) Calculating to apply the damage value in the second stage, that is

Here for the materials of happened strain hardening, ; and for Masing’s ones,  .
.
(3) The condition 3
To apply the assessment method of the total damage value in the whole process, that is
 ,
,
Here,  ;
;
or ; .
If it can be corresponded under all conditions mentioned above, then it is subjected to a safe state in a definite time; Otherwise, it isn’t a safe case.
4. Calculating Example
The steel 30CrMnSiA is a Masing’s material, its strength limit  , yield limit
  ,
, ,
,  ,
,  ; Working stress
  , supposing proportional limit
  ,
,  . If it is being calculated in design, to try to calculate respectively following data:
(1). Calculate the threseld value of damage, the critical value , the  and the total
  of damage for the material;
(2). Calculate the factors  and
and  of damage stress intensity corresponded to each critical damage values mentioned above, respectivaly;
(3). Use two kind of assessment methods to make evaluating for the security of the material.
The processes and steps of calculations are as below.
1. Calculating for each threshold value , critical ones , and of damage, and make assessment for the material’s safety.
(1) According to the formulas (15-1), (1), (2), and (11), for the critical value of damage , the damage value  , the threshold and the transition are calculated respectively as below:
1) The critical value is as below,
 ;
;
2) The value of damage is,
 ;
;
3) The threshold value of damage is,
 ;
;
4) The transitional value between two stages is as below,
 ;
;
So that  , the damage must grow for the material.
Now the  and
and  ,
,
Therfore, data in the first stage is already subjected under a case of unsafety.
(2) According to the formulas (15-2), for the damage in the second stage are calculated as follow:
1) The damage value is,
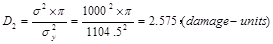

So, the calculating result of this stage is also not safe.
(3) According to the formulas (19) and (20), calculations for total damage values in the whole process are as follow,
1) The total value of damage is,

2) The critical values of damage are,
 ,
,
 .
.
Here it should take the larger value of both data.
3) The permited value is
 ;
;
The results from the two data can see as following,
Both the  , and
, and 
So, the material for the structure is necessarily the result of fracture.
2. To calculate the factor’s values  and of the stress intensity, make an assessment for the safety, respectively.
According to the formulas (11), (12), (13) and (14), for each factor values  and total critical of damages in the whole process are calculated as below, respectively.
1) The factor value  corresponded to the yield stress in the first stage is as below

2) The factor value  of macro damage in the first stage is,

3) The factor value  of damage in the second stage should be,
 ,
,
And the 
The permited value is,

So that the  not only over the
  , but also over the
  , it must be unsafety.
The total value of damage factor in the whole process is as below,

And the total critical value of damage factor in the whole process is
 ,
,
Here can see, this critical value of damage with the experimental data ( of that stress intensity factor in table 5 is relatively approximating.
The permited value is,
 .
.
Now, 
and 
So that the damage state for the material will certainly fracture.
Here it can find out, the results for two kinds of calculating and assessment that is coincident.
5. Conclusions
(1). The calculatung equation that it is a damage value  at transition point between the elastic and plastic strain, it is suited to materials shown strain hardening and particularly Masing ones.
(2). As the yield stress  is the only the constant shown own inherent property, so that the new critical value depended on the , that is also the sole, and the is a calculable parameter. Similarly, because the fracture stress
  is the only the constant shown own inherent one, the new critical value depended on the that is also the sole.
(3). The critical  and of damage are inherent constants shown the materials’characters; so the critical stress factors
  and
and  based on and are also sole values, and are all calculable ones.
(4). In assessment for damage strength, there are two kinds of methods that are calculated by the damage factor and by the damage value, both is consistent, and the later way is more simpleness.
(5). For Masing’s materials, the total critical  of damage is also the only, and it is another new constant shown a material’s propertiy; therefore its critical stress factor
  based on
  is also the sole value. Those and are also calculable; Their computing models can be used to calculate both for the safe assessment to some materials preexistted a flaw and for predicting damage in some structure designs; But for some steels as the 40Cr of shown strain softening, both error between the calculated and the experimental data is bigger.
(6). In those computing models are proposed by the author, if readers want to apply into engineering calculations, it must yet be verified by combined experiments, and it has to consider the influences for the shape and size to the crack and the structure.
Acknowledgments
Author thanks sincerity the Zhejiang Guangxin New Technology Application Academy of Electromechanical and Chemical Engineering gives to support and provides research funds.
References
- Yan Gui Yu. Damage Growth Rate Calculations Realized in Whole Process with Two Kinks of Methods. American Journal of Science and Technology. Vol. 2, No. 4, 2015, pp. 146-164.
- Yangui Yu. The Life Predicting Calculations in Whole Process Realized from Micro to Macro Damage with Conventional Materials Constants. American Journal of Science and Technology. Vol. 1, No. 5, 2014, pp. 310-328.
- Yangui Yu. Life Predictions Based on Calculable Materials Constants from Micro to Macro Fatigue Damage Processes. American Journal of Materials Research. Vol. 1, No. 4, 2014, pp. 59-73.
- Yangui Yu. The Life Predicting Calculations Based on Conventional Material Constants from Short Crack to Long Crack Growth Process. International Journal of Materials Science and Applications. Vol. 4, No. 3, 2015, pp. 173-188. doi: 10.11648/j.ijmsa.20150403.15.
- Yangui Yu. The Life Predicting Calculations in Whole Process Realized with Two kinks of Methods by means of Conventional Materials Constants under Low Cycle Fatigue Loading. Journal of Multidisciplinary Engineering Science and Technology (JMEST) ISSN: 3159-0040 Vol. 1 Issue 5, December – 2014.
- Yangui Yu. Calculations for Crack Growth Rate in Whole Process Realized with Two Kinks of Methods for Elastic-Plastic Materials Contained Crack. Journal of Materials Sciences and Applications. Vol. 1, No. 3, 2015, pp. 100-113.
- Yangui Yu. The Life Predicting Calculations in Whole Process Realized by Calculable Materials Constants from short Crack to Long Crack Growth Process. International Journal of Materials Science and Applications. Vol. 4, No. 2, 2015, pp. 83-95. doi: 10.11648/j.ijmsa.20150402.13.
- Yangui Yu. The Calculations of Crack Propagation Rate in Whole Process Realized with Conventional Material Constants. Engineering and Technology. Vol. 2, No. 3, 2015, pp. 146-158.
- Yangui Yu. Calculations for Crack Growth Rate in Whole Process Realized with the Single Stress-Strain-Parameter Method for Elastic-Plastic Materials Contained Crack. 《AASCIT》 Journal of Materials Sciences and Applications. Vol. 1, No. 3, 2015, pp. 98-106.
- Yu Yangui, Sun Yiming, MaYanghui and XuFeng. The Computing of intersecting relations for its Strength Problem on Damage and Fracture to Materials with short and long crack, In: International Scholarly Research Network ISRN. Mechanical Engineering, Volume, Article ID 876396. http://www.hindawi.com/isrn/me/(2011).
- Yangui Yu. Multi-Targets Calculations Realized for Components Produced Cracks with Conventional Material Constants under Complex Stress States. 《AASCIT》 Engineering and Technology. Vol. 3, No. 1, 2016, pp. 30-46.
- China Machine Press, Mechanical design handbook, New Edition, Volume 5.31~124~135; 31-57~60; 31-134~136. (in Chinese).
- Shaobian Zhao and Zhongbao Wang, Anti-Fatigue Design---Methods & Data, China Machine Press, P. 90-109, 469-489.
- Masing, G. Eigerspannungen and Verfestigung bein Messing, Proceeding of the 2nd International Congress of Applied Mechanics, Zurich, 1976, pp. 332-335.
- David Broek Elementary Engineering Fracture Mechanics, Third revised edition Martinus Nijhoff Publishers, 1982, 6~14.
- Michael F. Ashby and David R. H. Jones, Engineering Materials, An introduction to their propertied and applications, Pergamon Press, 1980, P. 145~147.
- B. P. Kogaev, H. A. Maxymov, A. P. Gycenkov. Calculations on Strength and Durability for the Structure and Mechanical parts, Handbook, Machinery Industry Press, Moscow, 1985 70~75. (in Russian) (B. П. Koгaeв, H. A. Maxymoв, A. П. Гyceнкoв. Pасчеты Деталей Mашин и Kонструкций на Прочность и долговечность, Cправочник, Машиностроение 1985, Москва, 70-75).
- S. V. Doronin, et al., Ed. RAN U. E. Soken, Models on the fracture and the strength on technology systems for carry structures, (Novosirsk Science, 2005), PP. 160-165.(in Russian).
- U. Zerbst, S. Beretta, G. Kohler, A. Lawton, M. Vormwald, H. Th. Beier, C. Klinger, I. C erny´, J. Rudlin, T. Heckel a, D. Klingbeil, Safe life and damage tolerance aspects of railway axles – A review. Engineering Fracture Mechanics. 98, 214–271 (2013).
- Yangui Yu. The Calculations of Evolving Rates Realized with Two of Type Variables in Whole Process for Elastic-Plastic Materials Behaviors under Unsymmetrical Cycle. Mechanical Engineering Research. Canadian Center of Science and Education 2012; 2. (2): 77-87; ISSN 1927-0607 (print) E-ISSN 1927-0615 (Online).
- Yangui Yu, The life predictions in whole process realized with different variables and conventional materials constants for elastic-plastic materials behaviors under unsymmetrical cycle loading, Journal of Mechanics Engineering and Automation. 5 (2015) 241-250. doi: 10.17265/2159-5275/2015.04.006.
- Yangui Yu. The Predicting Calculations for Lifetime in Whole Process Realized with Two Kinks of Methods for Elastic-Plastic Materials Contained Crack.《AASCIT》Journal of Materials Sciences and Applications. Vol. 1, No. 2, 2015, pp. 15-32.


