Calculations and Assessment for Cracking Strength to Linear Elastic Materials in Whole Process---The Genetic Elements and Clone Technology in Mechanics and Engineering Fields
Yangui Yu1, 2
1Principal Office, Zhejiang Guangxin New Technology Application, Academy of Electromechanical and Chemical Engineering, Hangzhou, China
2Wenzhou University, Wenzhou, China
Email address
Citation
Yangui Yu. Calculations and Assessment for Cracking Strength to Linear Elastic Materials in Whole Process---The Genetic Elements and Clone Technology in Mechanics and Engineering Fields. American Journal of Science and Technology. Vol. 3, No. 6, 2016, pp. 152-161.
Abstract
The author bases on the principles of similar to the genetic genes in the life sciences, discovers some new constants shown material properties from a short crack to long crack, and proposes some new computing models which are the calculable length of a crack, the threshold size and the critical ones on crack problem to some metallic materials; which are to use the theoretical approach, to adopt the conventional material constants, to derive the new mathematical models and the stress factor of called crack strength, to provide simple assessment criterions on the crack strength and the calculating methods in each stage. In addition, supplements again the comprehensive figure of the material behaviours; gives yet a detailed calculating example for a safety assessment.
Keywords
Principles of Genes, Conventional Constants, Threshold Size of Crack, Critical Size of Crack, Assessment Method
1. Introduction
The author thinks that in the mechanics and the engineering fields where it exists such a scientific law as similar to genetic elements and cloning technology in the life sciences, and had used the theoretical approach for similar principles, proposed some calculation models [1-6], recently sequentially discovered some new scientific laws to the Masing’s and the elastic-plastic materials, and provides some new calculable models for the crack growth driving force, the calculating criterions and the assessment methods about the strength problems in the whole process which are from short to long crack growth. This is to try to make the modern fatigue, the damage mechanics and the fracture mechanics gradually become such calculable disciplines as the traditional material mechanics and structural mechanics. That way, it may be there are practical significances for decreasing experiments to stint manpower and funds for promoting and developing engineering and applying it to relevant disciplines.
2. A New Comprehensive Figure on Materials Behaviours
About problems among branch disciplines on fatigue-damage-fracture; about problems among the traditional material mechanics and the modern mechanics for communications and connecting their relations with each other, we must study and find out their correlations between the equations, even the relations between variables, between the material constants, and between the curves. This is because all the significant factors are to be researched and described for materials behaviours at each stage even in the whole process and are also all to have a lot of significations for the engineering calculations and designs. Therefore, we should research and find an effective tool used for analyzing the problems above mentioned. Here, the author provides the "Comprehensive figure of materials behaviors" as Figure 1 (or the bidirectional combined coordinate system and simplified schematic curves in the whole process, or combined cross figure) that both is a principle figure of materials behaviors under monotonous loading, and is one under fatigue loading. It is also a comprehensive figure of multidisciplinary. Here in two problems to present as below:
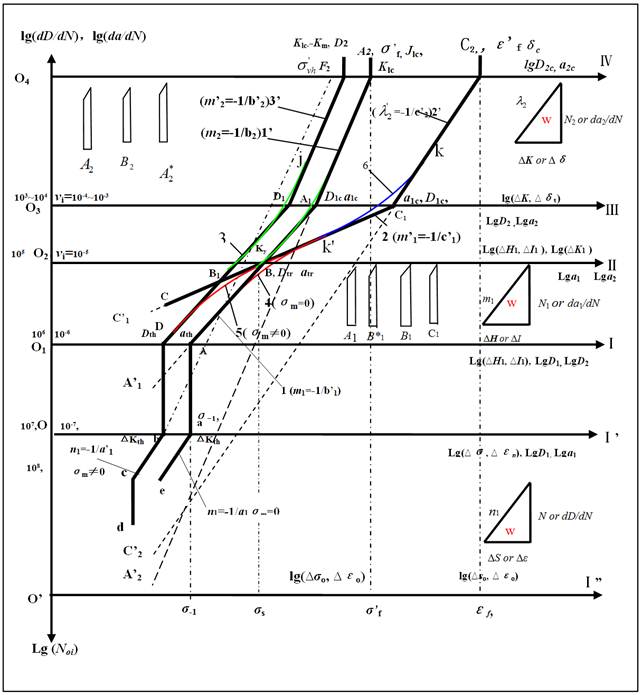
Figure 1. Comprehensive figure of material behaviours (Or called calculating figure of material behaviours or bidirectional combined coordinate system and simplified schematic curves in the whole process).
2.1. Explanations on Their Geometrical and Physical Meanings for the Compositions of Coordinate System
In figure 1, it was being provided by the present author; at this time it has been corrected and complemented, that is, diagrammatically shown for the damage growth process or crack propagation process of materials behavior at each stage and in the whole course.
For the coordinate system, it is to consist of six abscissa axes  I",
I",  I’,
I’,  I,
I,  Ⅱ,
Ⅱ,  Ⅲ,
Ⅲ,  IV and a bidirectional ordinate axis
  . For the area between the axes I" and I’, it was an area applied as by the traditional material mechanics. Currently, it can also be applied for the micro-damage area by the very high cycle fatigue. Between the axes I’ and Ⅱ, it is calculating area applied for the micro-damage mechanics and the micro-fracture mechanics. For the areas among the Ⅱ, the Ⅲ and IV, which are calculated and applied by the macro-damage mechanics and the macro-fracture mechanics. But for between the axes I and Ⅱ, it is calculated and applied in areas both for the micro-damage mechanics and for the macro-damage mechanics, or both for the micro-fracture mechanics and for the macro-fracture mechanics.
On the abscissa axes I", it are represented with parameters the stress  and the strain
 as variables. On the abscissa axis I’ there are the fatigue limits
  at point "a"
  and "b"
  that they just are the locations placed at threshold values for crack (damage) growth to some materials; on the abscissa axes I there are points "A" and "D" that just are the locations placed at threshold values as some materials. On the abscissa axes I and Ⅱ that they could all represented as variables with the stress intensity factor range
  of short crack, and the strain intensity factor
  , and the stress intensity factor range
  of long crack. On the other hand, they both could yet represented as variables with the short crack
  and the long crack
  (or damage
  and
and  ). And here there are material constants of two that they are defined as the critical factor
  of crack-stress-intensity and the critical factor
  of the damage-stress-intensity at the first stage, where that are just two parameters corresponded to the transitional size
  of crack or the transitional value of damage
 , they are just placed at point at the point B and at point
  corresponded to yield stress, that are also the boundary between short crack and long crack growth behaviors; but for some brittle materials would be happened to fracture to this point when their stresses are loaded to this level.
On the abscissa axis O3 Ⅲ, it is represented as variable with the stress intensity factor (or  ) of long crack; it is also a boundary of the sizes as the residual strength between some elastic-plastic materials and brittle materials. On this axis O3 Ⅲ there are the variables and the critical points at D1 and D1c, A1 and A1c, C1 . On abscissa IV, the point
 is corresponding to the fatigue strength coefficient
  , the critical stress intensity factor values
 and the critical values
  and
and  for the mean stress
  ; the point is corresponding to the
  ; the point
  corresponding to the fatigue ductility coefficient
  and critical crack tip open displacement value
  ; the point
  corresponding to a very high cycle fatigue strength coefficient
  . In addition on the same IV, there are yet another critical values
 , etc. in the long crack propagation process.
For the ordinate axis, upward direction along the ordinate axis is represented as crack growth rate  or damage growth rate
  at each stage and in the whole process; the downward direction is represented as life
  at each stage and in the whole lifetime
  .
.
In the area between axes I" and Ⅱ, it is the fatigue history from un-crack to micro-crack initiation. In the area between axes I’ and Ⅱ, it is the fatigue history relative to life  from micro-crack growth to macro-crack forming. Consequently, the distance
  on ordinate axis is as the history relating to life
  from grains size to micro-crack initiation until macro-crack forming; the distance -
 is as the history relating to the lifetime life
  from micro-crack initiation until fracture.
At the crack forming stage, in the partial coordinate system made up of the upward ordinate axes and the abscissa axesI’,I and Ⅱ is represented for the relationship between the crack growth rate  (or the short crack growth rate
  ) and the crack-stress factor range (or the damage strain factor range
  ). In the macro-crack growth stage, the partial coordinate system made up with the ordinate axis and abscissa Ⅱ, Ⅲ and IV at the same direction is represented to be the relationship between the macro-crack growth rate and the stress intensity factor range
  ,
,  -integral range
  and crack tip displacement range (
 -, and ). Inversely, the coordinate systems made up of the downward ordinate axis and the abscissa axes IV, Ⅲ, Ⅱ, I, and I’ are represented respectively as the relationship between the
  -, - range and each stage life and the lifetime (or between the
  -, - range and the life ).
2.2. Explanations on the Physical and Geometrical Meanings of Relevant Curves
The curve  is represented as the varying laws as the behaviours of the elastic materials or some elastic-plastic ones under high cycle loading in the macro-crack-forming stage (the first stage): positive direction represented as the relations between -; inverted
  , between the
  . The curve
  is represented as the varying laws of the behaviours of the elastic-plastic materials or some plastic ones under low-cycle loading at the macro-crack forming stage: positive direction is represented as the relations between -; inverted
  , the relations between the
  .
.
The curve  in the crack growth stage (the second stage) is showed as under high cycle loading: positive direction showed as - (); inverted
  , between the
  ,
, . The
. The  is showed as: the positive, relation between the - under low-cycle loading, inverted
  , between ()-
 . By the way, the curves
 and the
  () are represented as the laws under the very high cycle fatigue.
It should yet point that the curve  (1-1’) is depicted as the rate curve of damage (crack) growth in whole process under symmetrical and high cycle loading (i.e. zero mean stress,
  ); the curve
  (3-3’), as the rate curve under unsymmetrical cycle loading (i.e. non-zero mean stress,
  ). The curve
  (2-2’) is depicted as the rate curve under low cycle loading. The curve
  is depicted as the damage (crack) growth rate curve in whole process under very high cycle loading (
 ), the curves
  and
and  are depicted as ones of the damage (crack) growth rates in whole process under very high cycle loading (
 ). Inversely, the curve
  is depicted as the lifetime curve under symmetrical cycle loading (i.e. zero mean stress,
  ), the curve
  , as the lifetime curve under unsymmetrical cycle loading
  . The curve
  is depicted as the lifetime curve under low cycle loading
  . On the other hand, the curve
  is as the lifetime one in whole process included very high cycle fatigue (
 ), the curves
  and
and  are all depicted as the lifetime ones in whole process
  .
.
It should also be explained that the comprehensive figure 1 of the materials behaviours may be as a complement for a fundamental research of the material subject; that is a tool to design and calculate for various kinds of structures and materials under different loading conditions, and it is also a bridge to communicate and link the traditional material mechanics and the modern mechanics.
3. Strength Calculations on a Crack Under Monotonic Loading
Here for the variable a describing the crack growth process, it is defined as follows:
1) From micro-crack initiation to macro-crack forming process, it is defined in the crack forming stage or defined in the first stage, that is corresponded to the variable a1 of the short crack, it is represented as the curve AA1 in figure 2;
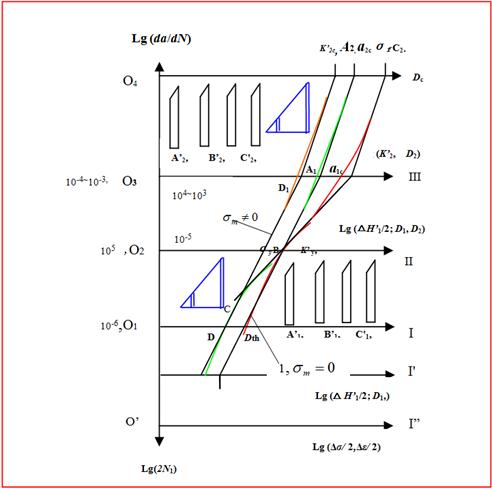
Figure 2. The figure of the crack behaviours in whole process.
2) From the macro-crack propagation to the fracture process is defined in the long crack growth stage, or defined in the second stage. The variable a2 of this stage is called as the long crack one, that it is corresponding curve A1A2 in figure 2;
3) From a micro-crack initiation to long crack growth until full fracture of a material, to adopt variable a in the whole process, it is corresponding curve AA1 A2 in figure 2.
3.1. About the Driving Force and Threshold Size on Crack Growth
In the figure 2, it can be seen that differences with the loading ways and the stress levels, for the general steels, their behaviours were always shown differences in the each stages, but they are all to exist the threshold values  of the crack, only depended on the exponents
  related to the material character in table 1.
Table 1. Threshold sizes of the crack shown the material character.
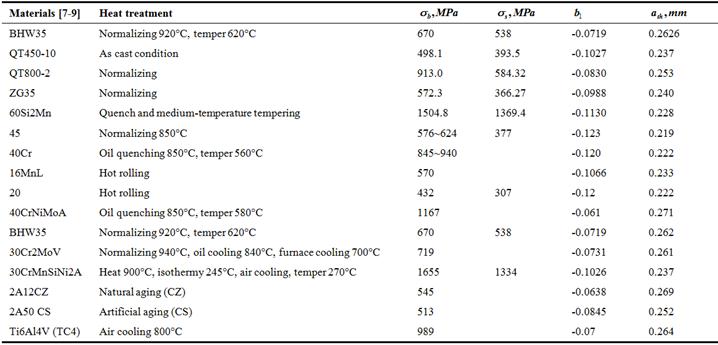
It should point, the locations of the threshold sizes of the cracks, some materials are near at the point A where it is at the intersection one between the straight line AB and the abscissa axis  I in figure 1; and other ones, near at the point a where it is at the intersectional point between the straight line "Aa" and the abscissa axis
  I’. And the threshold size can be calculable parameter with as following formula, it should be [10]

 (1)
(1)
Or
 (2)
(2)
The range of the threshold size is the 0.21~0.275 (mm). For linear elastic materials, to make the is combined with the stress , so that it can make a model of the driving force that is as below.
 (3)
(3)
In the formulas (2-3),  . The
. The  is defined as the stress intensity factor of short crack [10]. In an ordinary way, the
  may be: the
  or
or  , then the strength criterions for them are as below,
 or
or (4)
(4)
Or
 or (5)
Where the  is defined as the threshold factor of the short crack. If the
  , the crack in a material does not grow; but, the
  , the crack is must be to grow.
3.2. Strength Calculation on Crack at the First Stage
When a short crack gradually grow to the long crack where it is corresponding to the curve 1( ) or the "aAB" between the abscissa axes O I’ and the O2 II in figure 2. Here it can set up the strength criterion for it in the first stage, which is as below form,
 (6)
(6)
 (7)
(7)
Where the  in (7) is defined as a critical value of the stress intensity factor in first stage, it is a value corresponded to the critical value and the transitional size of a crack, also are the constant values on the boundary between the short crack and the long crack. Their locations are respectively at points B on abscissa axis O2-II (in Fig. 2).
It should yet explain, the crack in the eq. (6) mentioned above may be calculated to take the size of preexisted a flaw in a component, or it can also applied into predicating calculations by a designer for a design. If the designing stress is less than the elastic limit  , the calculating of the crack length can be adopted as following calculable formula,
 (8)
(8)
Here the  is a stress value of proportional limit (approximating to the elastic limit), it can also approximatively be took for definite ratio by the yield stress, for example
  , if the data is to lack.
The  is a conversion coefficient of the unit,
  .
.
3.3. Strength Calculation on Crack at the Second Stage
As is well known, the mathematic model to describe a crack in fracture mechanics that it is to adopt these "genes" and  and crack variable
  , thereby to make the stress intensity factor; Here it can make the model of driving force for the describing behavior of it as following form [11-13].
 (9)
(9)
Here is sure to explain, the area between the abscissa axis O1-I and the O2-II in fig. 2, the crack sizefrom the threshold to  , there are the mathematic models of the stress factors of two kinds, which are all suited in the section. In addition to above equations (6-7) can be applied, in theory another mathematic models (9-13) are still suitable in the area.
Where the  is also called as a stress intensity factor of short crack that it is equivalent to , but their dimensions and units are differences at this same point, then the model of driving force corresponded at that critical point B should be as follow
 (10)
(10)
 (11)
(11)
Where the is defined as the critical stress factor that is corresponding to a crack size  of the transitional point, and just is to that size
  of forming macro crack, is the very at point B to the yield stress
  on abscissa axis O2-II in fig. 2. Here it need yet explain, this factor should theoretically be equivalent to above mentioned the in first stage, although the dimensions and units between them are different. In addition, the
  is a strength coefficient under monotonic loading, its unit is the "
 ". The
  is an exponent happened strain hardening.
Over the abscissa axis O2-II, the crack over the transitional point size is to adopt the as the variable. During a crack growth gets to the size of long crack, which it is depicted as corresponding to the curve  in figure 2, then its strength criterion should be calculated as following form,
 (12)
(12)

 (13)
(13)
Where the  [14-15] is a correcting factor related with the shape and the size of a crack, the
  is a the critical factor called during the long crack growth, it is corresponded to the critical size
  on abscissa axis O3-III in fig. 1, also a the critical value in the second stage. The
  is defined as the permitted value; the "n" is a safety factor; and the is a critical size corresponded to the yield stress in the first stage. It should point, because the yield stresses is the constant of uniquenesses for a material, the critical size of crack can also be applied as an important parameter showed its property. In practice, the critical value could be calculated by means of below formula:
 (14)
(14)
But, for some cast irons, steels of the low toughness and brittle materials, which their behaviours are depicted as curve  between the abscissa axis OII and the O3III. When their stresses are loaded to this level, or gotten to the critical values
  of long crack, that may be happened to fracture.
Here has to point the calculating equations mentioned above are only suitable for some brittle materials and strain hardening ones. The calculating error is larger for the materials to happened strain softening.
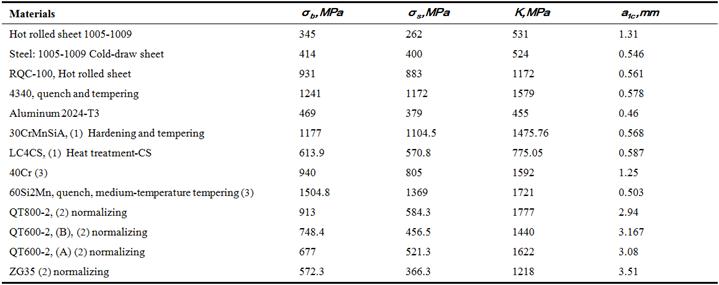
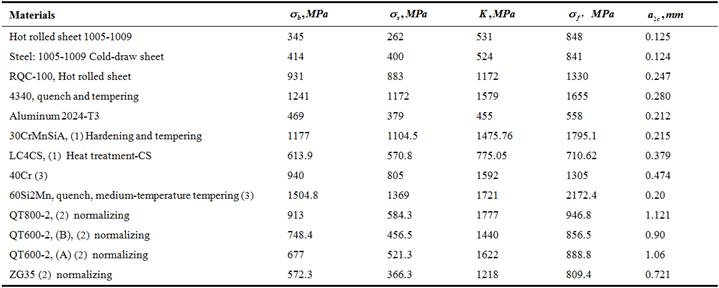
In the table 2, here are listed to the critical sizes of crack for 13 kinds of materials.
Table 2. The critical sizes  of crack in first stage.
Note:  is strength limit;
  is yield limit; (A)-Bar
  ; (B)-Y-type test specimen;
(1)---The Masing’s materials; (2)---The cycle-harden material (3)-Cyclic softening.
It could see from table 2, where the materials from the first to ninth kind are all the steels, their critical sizes of cracks are the range in 0.43~1.42mm to this stage. But the materials from the tenth to thirteenth, which are the nodular cast irons and a cast iron respectively, their critical sizes are the range in 2.94~3.51 mm. In practice as the cast irons are subject to brittle materials which get already the critical values of the fracture under the equivalent yield stress, then those materials will occur to the failures.
For the behaviours of another materials could be over the abscissa axis O3III in figure 1, while they get to own critical values of long crack, which are usually later than the brittle materials above mentioned, their life are also longer. So the abscissa axis O3III is a boundary that can be thought for the residual intensity sizes between different materials in crack growth process. In this case,that strength criterion (12-14) on crack mentioned above can still be suited for calculations.
When the crack growth over the abscissa axis O3III in figure 2, the strength criterion of crack at later time in the second stage should be as below form
 (15)
(15)
 (16)
(16)
Where the  is also the stress factor of crack in the second; the
  is a critical factor when it is momentary fracture to the crack, that it is equivalent to the critical stress intensity factor
  in fracture mechanics. The
  is a fracture stress, the
  is a critical crack value where it is at the crossing point A2 on the abscissa axis O4-IV and the straight line 1
  in fig. 2.
It should yet explain because the is also a material constant, it must be the data of uniqueness to show a material performance, and it could be calculated out by means of the fracture stress  (table 2). So that the critical size of crack
  under corresponding to the true stress should also be the only data. In theory, it must be there is as following functional relationship,
 (17)
(17)
By the way, when a structure is calculated for a crack size predicting in design, the crack length  in the equations (11, 14) can be used as following calculable formula,
 (18)
(18)
Here  is a converting coefficient, 1-damage unit=1mm,
  .
.
Recently the author researches to discover that the strength coefficient on material subject is virtually the very the critical stress intensity factor  on fracture mechanics under the monotonous loading, if their calculating parameters take all same units. For instance, for the hot rolled sheet 4340 in table 2-3, its
  ,
,  ,
,  , then if to adopt the calculating model in fracture mechanics to calculate the strength coefficient , that is as below,
 .
.
On the other hand, the practical calculable critical factor on fracture mechanics subject should also be,
 .
.
So, the calculating results are completely consistent. Where its unit to be  of the
  which was called as the strength coefficient in material subject that it is actually the very the critical stress intensity factor in fracture mechanics, and the units of both should be all
  or
or  . Here it should be point that the experiment values of the are also 50~63
  .
.
In the table 3 is listing the critical sizes of some materials.
Table 3. The critical sizes  of crack in second stage.
Note: is a strength limit; is an yield limit; (A)-Bar ; (B)-Y-type test specimen;
(1)---The Masing’s materials; (2)---The cycle-harden material (3)-Cyclic softening.
4. Calculating Example
A test specimen made of nodular cast iron QT800-2, its strength limit  , yield limit
  ,
,  , its material constant
  ,
,  , the strength coefficient
  , the strain hardening exponent
  , fracture stress
  ; If a designer needs to do predicting calculations for a crack strength, to suppose working stress
  , the proportional limit
  ,
,  , to try to calculate respectively following data:
(1). Calculate the length  of the crack, the threshold size , the critical size and the of crack for the material, respectively;
(2). Calculate the stress factor  the threshold factor
  the critical factors
  and of the crack, respectively;
(3). To use the assessment method of the stress factor to do an assessment for it.
The processes and steps of calculations are as below.
(1). To calculate the crack length  under work stress, the threshold size, the transitional size , the critical and of crack, and to do an assessment for the material.
Here 
1) According to the formula (1), the threshold size is,
 ;
;
2) According to the formula (11), the transitional size is as below,

3) According to the formula (14), its critical size of the crack at the first stage is
 ;
;
4) By the formula (8), its crack size corresponded to the working stress 550 MPa should be as below,

 ;
;
So the crack in the material is necessarily to grow.
5) According to the formula (18), its crack length under work stress at the second stage is

6) By the formula (17), its critical size at the second stage should be,
 ;
;
(2). To calculate the stress intensity factor and the critical value for the crack in the first stage, respectively.
1) According to the formula (6), its stress factor of crack is
 .
.
2) The critical factor of the crack is as below,
 .
.
3) Its permitting value should be,

 .
.
So that  .
.
Therefore, the calculating result by the criterion in the first stage, that is not safe.
(3). To calculate the stress intensity factors and , the critical values and for long crack in the second stage, respectively.
1) According to the formulas (10) ~ (16), the factor, the threshold value corresponding the yield stress  and the critical one of long crack are respectively as follow,
a) For the stress factor of the long crack is

b) The threshold value of the crack corresponding to the yield stress is as below

So 
Then, the crack must be to grow.
c) The critical factor of crack in this stage is

d) Its permitted value should be,

e) On the other hand, the critical value of stress factor when the crack are been at momentary fracture is as follow,
 .
.
Here it can see out that the 
Its permissible value of crack factor is

So that 
Therefore, the data calculated by the criterion for the macro-crack and the result calculated for the design are not all safe to the material.
Here it can see from the above calculations, for the critical factors of a crack, the  , because corresponding to the point of the -value just is the one of the
  -value where they are at same point A2 on abscissa axis O4 IV; but for their critical sizes of cracks,
  . So when to take the value for the
  , it must only be calculated by the
  or
or  with the safe factor
  .
.
5. Conclusions
(1). The crack length at different stage can be predicted to calculate out by means of the conventional stress and the material constants  and .
and .
(2). The new threshold size of the short crack that can show own inherent property, that is depended on the sole material constant b1, is a calculable one.
(3). For some materials of the brittle and happened strain hardening under monotonous loading, as the yield stresses  is the only the constant shown own inherent property, so that the new critical size
  of crack depended on the to be also the sole, and the is a calculable parameter. Similarly, because the fracture stresses is the only the constant shown own inherent one, so that the new critical size of crack depended on the to be also the sole and calculable.
(4). The critical sizes and of cracks are inherent constants shown the materials’ characters; so the critical stress factors  and
and  based on and are also sole values, and are all calculable ones; Their computing models can be used to calculate both for the safe assessment to materials preexisted a flaw and for the predicting crack strength in design process; But it may be calculating error to be larger for the shown strain softening’s ones.
(5). Because corresponding to the factor-value of the is the very one of the where they are the same at point A2 on abscissa axis O4 IV; but for their critical sizes of cracks,  . So for some materials of the brittle and happened strain hardening when to take the value for the it must only be calculated by the or with the safe factor
  .
.
(6). The strength coefficient on material subject is virtually the very the critical stress intensity factor under monotonous loading on fracture mechanics, if to take the fracture stress and the same unit  to calculate for them and . But, the unit for theis the "", not foregone that "
 ".
".
(7). In those computing models are proposed in the paper, if readers want to apply in engineering calculations, it must yet be checked to combine experiments, and it have to consider the influences for the shape and the size to a crack and a structure.
Acknowledgments
The author thanks sincerity the Zhejiang Guangxin New Technology Application Academy of Electromechanical and Chemical Engineering gives to support and provides research funds of 500 thousand yuan RMB.
References
- Yan Gui Yu. Damage Growth Rate Calculations Realized in Whole Process with Two Kinks of Methods. American Journal of Science and Technology. Vol. 2, No. 4, 2015, pp. 146-164.
- Yangui Yu. The Life Predicting Calculations Based on Conventional Material Constants from Short Crack to Long Crack Growth Process. International Journal of Materials Science and Applications. Vol. 4, No. 3, 2015, pp. 173-188. doi: 10.11648/j.ijmsa.20150403.15.
- Yangui Yu. The Life Predicting Calculations in Whole Process Realized with Two kinks of Methods by means of Conventional Materials Constants under Low Cycle Fatigue Loading. Journal of Multidisciplinary Engineering Science and Technology (JMEST) ISSN: 3159-0040 Vol. 1 Issue 5, December – 2014.
- Yangui Yu. Calculations for Crack Growth Rate in Whole Process Realized with Two Kinks of Methods for Elastic-Plastic Materials Contained Crack. Journal of Materials Sciences and Applications. Vol. 1, No. 3, 2015, pp. 100-113.
- Yangui Yu. The Calculations of Crack Propagation Rate in Whole Process Realized with Conventional Material Constants. Engineering and Technology. Vol. 2, No. 3, 2015, pp. 146-158.
- China Machine Press, Mechanical design handbook, New Edition, Volume 5.31~124~135; 31-57~60; 31-134~136.(in Chinese).
- Shaobian Zhao and Zhongbao Wang, Anti-Fatigue Design---Methods & Data, China Machine Press, P. 90-109, 469-489 (in Chinese).
- Yung-Li Lee, Jwo Pan, Richard B. Hathaway, Mark E. Barkey. Fatigue Testing and Analysis Theory and Practice. The first edition, Elsever Inc., USA. 142-152.
- Yangui Yu. Multi-Targets Calculations Realized for Components Produced Cracks with Conventional Material Constants under Complex Stress States.«AASCIT»Engineering and Technology.Vol. 3, No. 1, 2016, pp. 30-46.
- Yangui Yu, The life predictions in whole process realized with different variables and conventional materials constants for elastic-plastic materials behaviors under unsymmetrical cycle loading, Journal of Mechanics Engineering and Automation. 5 (2015) 241-250. doi: 10.17265/2159-5275/2015.04.006.
- David Broek Elementary Engineering Fracture Mechanics, Third revised edition Martinus Nijhoff Publishers, 1982, 6~14.
- Michael F. Ashby and David R. H. Jones, Engineering Materials, An introduction to their propertied and applications, Pergamon Press, 1980, P. 145~147.
- B. P. Kogaev, H. A. Maxymov, A. P. Gycenkov. Calculations on Strength and Durability for the Structure and Mechanical parts, Handbook, Machinery Industry Press, Moscow, 1985 70~75.(in Russian) (B.П. Koгaeв, H. A. Maxymoв, A.П. Гyceнкoв. Pасчеты Деталей Mашин и Kонструкций на Прочность и долговечность, Cправочник, Машиностроение 1985, Москва, 70-75).
- S. V. Doronin, et al., Ed.RAN U. E. Soken, Models on the fracture and the strength on technology systems for carry structures, (Novosirsk Science, 2005), PP. 160-165.(in Russian).
- U. Zerbst, S. Beretta, G. Kohler, A. Lawton, M. Vormwald, H. Th. Beier, C. Klinger, I. C erny´, J. Rudlin, T. Heckel a, D. Klingbeil, Safe life and damage tolerance aspects of railway axles – A review. Engineering Fracture Mechanics. 98, 214–271 (2013).


